Thursday, May 31, 2007

Good with the Bad

Thursday May 31st, 2007

Spot Light Trade(s)

See the three circled areas for today's spotlight trades.


Trade 1 - The first circled area at 11:05 CT on the 1-minute chart above is one of the few good pull backs in price that had a nice defined stair step higher in my direction line on the 5 minute chart for today, and traded for decent distance in today's smaller range day. This low came in with a nice relative low in the NYSE Tick.

In the 20 minutes prior to this point in time, the higher volume spikes in the 1-minute chart were mostly sell volume. The price action "looked" like it was curving lower like it could break lower. The NYSE Tick was staying mostly above the zero line, so I was not really interested in trying a short, but it was enough to distract me from thinking long. I missed this one and this is usually a trade I really like.

Trade 2 - A similar setup to trade 1. This time I was ready and jumped on the signal and got long. Price worked to 1 point in favor, I wanted to try and hold for more profits. After all, it worked great on the prior trade right. Well.. that takes us into trade 3.

Trade 3 - Similar setup again, only reversed to the short side. Wanting to hold the prior trade kept my focus from the short side. The 5-minute chart had "flat lined" the trend for about an hour and did not give me any indication of this move. By the time I realized I had missed a short signal, I was lucky to scratch out of the last trade at break even. It would have been good to reverse my position from long to short, but I have not allowed that in my rules yet.

Why would I do this? There are some subtle clues. The Volume is really light compared to what is expected. But if you look at the 5-minute volume, the "heavier" volume candles are the Red candles. It is hard to say heavier when the volume is this light, but a warning sign.

I think I wanted to see an end of month rally make my long trade a winner. This kept me from seeing the short trade and acting upon it in time.

Trade Wise, Trade Well
John

Tight Price Action

Thursday May 31st, 2007 ES Futures

How did it go today

The 5-minute chart does not do the price action justice. Most of my entry signals for today came while price was in tight sideways chop. Notice in the light blue lines in the 5 minute chart below. These lines defines my calculated "immediate trend" that tells me the direction to focus on trades. If the lines "stair step" lower, I look for short entry signals and if the lines "stair step" higher, I'm looking for long trades. As you can see, there are not many steps in the same direction today.


Too often it seemed price was buzzing sideways in about a 1-point range for 10 to even 30 minutes. This left me scratching my head saying the signal really worked. It was just me who did not trust that price would not actual "move" against my entry and cause me to use a bigger stop that I wanted for the trade.
Trade Wise Trade Well
John

Wednesday, May 30, 2007

Ten Rounds

Wednesday May 30, 2007 ES Futures

How did today go

The title of this post says it all. I feel like all I did was fight the market today. I need to figure out why I fall into this ruts where I fight the market and worse yet... fight what my own system is telling me to do. I took more trades than I should have today and too many of them were short trades.

Not good when the market goes up 20 points. Chalk up another day in the not what I should have made today category. Today's price action seems to consolidate sideways for 10 minutes then pop up or down quickly in just a minute or two.

My bias last night was to watch for a potential trend day for the end of the month. Well... we got a trend day. I normally try not to have a bias and just trade the price action. I guess I did too good of a job clearing my head of any biases.

Struggling for a good spotlight trade to present for today. I'll see if I have more time later tonight.

Trade Wise, Trade Well
John

Tuesday, May 29, 2007

New Style - Spot Light Trade

Tuesday May 29th, 2007 ES Futures

Trying to be more brief - let me know if you like this format or the long style with more details.


How today felt
I was overly cautious today. I knew I would be gone for some of the day and did not want to dig a big hole when I would not be around as much to work my way back out. I felt I kept my focus pretty good in the morning, but still managed to force a few trades to add some small losses to my mix of trades.

Spot Light Trade
I caught one very good entry. Just before 10:42 CT I had a short signal. The initial look at the 5 minute chart makes this look like a counter trend trade. But by the close of the 10:45 CT candle, the 5-minute chart had a slightly lower high to indicate a potential change in direction.

I had to get going to my youngest daughter's graduation from preschool and the price action was trying to hold up. The NYSE Tick was looking weaker and I still liked being short here. As I needed to be gone already, I took the first half off at +0.50 seconds before the market decided to dive. :-(

All of a sudden I was up 2 points on my remaining position. Under normal circumstances I would now take profits on the first half and I would allow the second half to run with a loose stop. You may have already guessed, wanting to lock in some profits I crowded the stop and got knocked out at +2.0 points just before the market started lower again and I ran out the door.

Summary
I'm still forcing some extra trades that I should not be taking. I caught myself a couple times today, but still managed to place some of these extra trades. As price moves without me, I can not let myself "Feel" that I'm missing out as this feeling builds and will eventually drive me to force some trades if I do not clear the thought from my mind.

I don't expect to trade every move in the market. My system does not try to stay in the market all the time. I need to focus on the clearest and best entry signals.

Trade Wise, Trade Well
John

Thursday, May 24, 2007

High Volume Day

Market Observations

Today started slow. But it did not last long. Two of the first three 5 minute candles had volume less than the average expected for their time period. The average expectation for volume can be seen in the chart by looking at the blue line. this threshold value changes for each 15 minute time period of the day. Note how only a handful of 5 minute candles had volume less than the expected average.

The initial light volume had me cautious to trade in front of today's 9:00 CT report. I had nice long signals and wished I realized the volume picked up so this I would have tried one of my two long entries. The market took off to the up side after the report and hardly looked back.

Formidable Resistance. Price quickly turned when it bumped into the combination of the R1 pivot and the Market Profile Point of Control from yesterday.

Big Selling. Our afternoon sell off started early today. I can say I'm going to start allowing myself to take more counter trend trades. I had a "perfect" sell signal at the first touch, the second time up to the high quickly retreated back down. Secondary sell signals were a "higher risk" trade signal, but worked great.

Almost did it again. Did you notice where the Midday low came in? Well look... The initial low touched 1513.00 and this is 2 ticks lower than twice the first hours range.
S3 calling. Twice the first hours range could not hold up the market in the afternoon. The S3 pivot level was beckoning. It was a struggle to get there. We pierced through this value and hit the 1508 level which I still had noted as a prior POC level of importance. The market popped slightly higher to close for the day.
Trade Wise, Trade Well
John

Wednesday, May 23, 2007

How Long Can We Trust That

WOW...

That makes three days in a row where we have sold off hard in the afternoon and closed near the low of the day. Did you expect it again today? I did not think it would repeat this many days.

BUT...

I can not prejudge and decide what the market will do. I need to follow my trade signals to stay on the proper side of the trend and jsut see what profits follow. The first long signals early in the morning worked great. Then the anticipated pull back from the initial highs. From here, I wanted the market to blast to the moon.

I talked myself into a scenario where the market just could not sell off a third day in a row. This just has to be a fakeout. Make price action look like we are setting up for a selloff, then blast higher.

Well I did not get killed, but I scratched out of too many long trades at break even, longing for more profits, instead of harvesting the available profits. Worst of all, I was "looking the wrong way" and did not take trades with the trend. I saw my short signals, but did not "want" to listen. So when my long trades got stopped out, I'm not short and end up watching the move go without me.

Today should have been an awesome day with profits that some people would think of as unbelieveable to obtain for one day of trading. Instead, I'm left disapointed at my trading. From now on, I must take the trades and let the market "show me" what it is going to do. I'm killing my profits "wanting" or "Hoping" the market does what I decided.

Trade Wise, Trade Well
John

Tuesday, May 22, 2007

It Happened Again

Well... this makes two days in a row.

What is it

Today's high came in at exactly twice the first hour's price range again. To the Tick. You can see this on the chart as the top of the Blue background represents twice the price range from the first hour of trading.

Wishing I shorted it just for fun, but I did not. I need to consider adding rules to get me more aggressive at price levels like this.


Right now I protect unrealized profits or even take profits just below these key levels. But I do not reverse or short these levels just because they are on my chart. I do have to admit that I'm often watching good trades go by that occur at or near key levels like the hourly range and twice the hourly range. Other key values include the Pivots, R & S values, and the Market Profile levels.

Trade Wise, Trade Well
John

Bad Moves

Monday 5/21/2007 ES Futures

How did it go

Got off to another bad start again today. I chased some trade entries when I should have just "thought" I missed the entry. Then I would have been glad I missed the entry watch price come back the other direction.

So once again, profits were eaten into by mistakes I should not have made.

The Chart for today will be in the Next post.

Trade Narrative

I have not heard from many people yet about this blog, I don't suspect there are a lot reading yet, but I'd love to hear from more of you. I'm trying to figure what level of detail to place in this public journal. Let me know. For now I'm switching more of a summary than I have used in my earlier posts.

Don't do that again - My first two trades I have to describe as "Chase" entries. This is where I enter late after the signal and can be as much as 1 point from where I feel the Signal triggered an entry. I was questioning the entry signals early as the volume was noticeable below the average expected volume for most of today. This light volume should have told me to ONLY take proper entries or wait for the next signal. My best entries can come a minute or two after the signal, but waiting for a better entry can also leave me out of the trade as well.

I took it easier and did not trade much more in the consolidation range that lasted for the first hour and a half of this morning's session. Saw some counter trend trades, but my rules have me on the sidelines until I have profits to risk against these trades.

Bought the Low - I felt a little better when I bent my counter trend rule and took a long trade near 1526.00 after 11:00 CT. This turned out to be the low of the day. I just saw a "big push" lower that only made a quick 2 tick lower low before price popped back up. On "low volume days" I like to fade the extreme moves. That is as long as we do not appear to be trending. Now if I just held on to this entry longer. I took some earlier profits, trying to make up for my first bad trades. My thought was that I'd reenter, but there was not a good entry until price had gone 5 points higher.

Hard to balance between "taking profits" and "letting profits run" and be right all the time. I just need to figure out how the market seems to make me feel that I get this wrong more than I get it right. :-)

Lessons Learned or Still Needing to Reinforce

Several lessons from today.
  1. Treat each trade separately - do not try to force one trade to compensate for prior losses.
  2. Do not chase Entries - I have told myself this before, but I keep chasing what I "want" to be a run away move. Not going to happen with low volume.
  3. Re-evaluate the Counter Trend Rule - On low volume days, I think I'll have to be more willing to take trades that are defined by my system as counter trend trades. I normally try to avoid these trades when I don't have profits built up for the day to risk on these trades. When price is chopping in a range, good signals occur on the edges of the range, but these is no real trend.
Trade Wise, Trade Well
John

Monday, May 21, 2007

There it is again

See the chart from my earlier post about my trading issues for today to see the Chart.

Notice where the Highs came in today?

If you did not see my earlier posts on this observation, I wanted to point out that it happened again. This time it was the High of the day instead of the low.

What is it?

Today's high price was almost exactly twice the range created within the first hour of trading. This can be seen by the Blue background that appears on my chart. Price could only get two ticks higher.

This was a big resistance area. R1 was 1533.00 and I also had Market Profits Targets just above 1534.00 as well.

Trade Wise, Trade Well
John

Charting Issues

Monday 5/21/2007 ES Futures

How did it go

Got off to a bad start. My charts decided to give me grief this morning. For some reason Investor/RT (IRT) does not like one of my charts. My chart that breaks candles down for every 1000 contracts traded has been giving me troubles off and on for too long now. This is the chart I use to help time my entries. This morning my Volume Break Down showed no values for the last few days and the start of the morning.

I tried to fix the problem and ended up missing just more than the first hour of trading. Big mistake as there was still good price movement today and I let theses issues throw me off.


Trade Narrative

Just missed it - I missed two long signals at better than 1528.00 entry price. The first signal would have finished as a profitable trade. The second signal was showing signs of working too. I was not real excited to join the trade late over 1 point above the entry as price action seemed quiet with lighter than average volume. I was trying to decide if the up tend was going to continue and I missed another entry as price ticked through 1528.00 and continued higher.

I was starting to decide to not trade this "light volume" price action and missed a couple of good long price swings. Frustrations with my charts just before the session open got the better of me today.


Lessons Learned or Still Needing to Reinforce

I should not have let myself get drawn into trying to resolve what appears to me to be a bug in the chart program I use. The issue only effects history and has been working for new real time data added to the chart. Save these issues for after trading hours.

Still, I should have better trusted my signals and got myself back on track. I would have had a couple of good trades late in the morning. I backed off for the day as my mistakes tend to be made most often in the midday and afternoon portions of the session. This means I need to focus in the early morning to build initial profits for the day.


Trade Wise, Trade Well
John

Friday, May 18, 2007

Limited Screen Time

How it Went Today

Today went great. I was doing "my fatherly duties" today and did not have much real-time chart watching. So it was good to spend some time with the family and get a break from the charts. Here is a 5 minute chart to review how the day went.

Trade Narrative

I was around to see the market open. I was trying to decide if I was going to take any trades today knowing that I'd be away from the screens more than I'd be able to monitor the price action and my trades.

I don't have many entries right off of the open. My setups rely on current price action and sentiment to develop before I fell I have a high probability trade setup. I was really interested in shorting 1522.00 just off of the open, there was a nice pattern in my Volume Break Down Delta telling me to go short.

The trouble is that this pattern can quickly flip back to the long direction so I like to see some price action to go with this signal to be more confident I'm entering with the trend and not just catching a quick retracement in price.

I did short at 1521.00 to probe and see if the initial down trend was going to continue. My first half did not fill at +1 point. I knew there was a 9:00 CT report coming and my objective was to try and have a "free" trade with the second half of my position in case price breaks hard down from the report. When price stalled, I took half off at 0.75 points or three ticks. Normally I would have held, but since I had to leave before the report hits, I made a compromise. I needed to get out the door and price was starting to inch up at me so I placed the stop at break even and left. I was confident that the stop would be hit just a couple ticks way from price. Maybe I should have just closed the trade. Either way there was not a big difference.

From this point on, I had just a couple of times where I had the chance to "check the charts" to see what I had missed out on. Each time I looked it seemed like I had just missed my entry, price was still close, but the trade was a counter trend trade.

Shortly after 9:30 CT I really really wanted to short 1525. I had a major cluster of resistance there. The R2 value I had at 1525.50, I had a Market Profile Target at 1525.00, and a second possible Market Profile Target at 1526. We just have to get enough of a bounce off of this price area for a small profitable trade.

I should have noted the entry price I could have grabbed as I sat down to the screens. I passed and watched as price did work its way lower then channel tight sideways before I was off again. This trade should have been good for 2 points and 2 points for each half the way I trade.

This time I was gone longer than I expected. I returned just before 1:30 CT. It was a quick read, but I could still get short just under 1527. I decided that I have a bad track record for trades I "instantly" identify at first glance after being away from the screens for a period of time. Passed again. Another possible 2 - 3 points

The afternoon looked like it could be flat to slightly higher. Well... make that a close at new highs for the weekend hype. Should have thought about that, but decided just to observe.

Lessons Learned

Don't over do it - make sure you get some time away from the charts every now and then. I think I was over due for a break.

Observations

Another choppy day. The price action yesterday had better defined "micro trends" on the 5 minute chart as defined by the light blue lines around the price action. Today had consolidation periods where the "upper trend line" went lower and the "lower trend line" went higher.

Today seemed easier to trade, but did not offer the same profit potential. Granted I was not there is real time like I normally would have been. Let me know what you thought trading the ES was like today. Did you stay awake and focused through the consolidation to catch the moves?

Trade Wise, Trade Well
John

Thursday, May 17, 2007

Interesting ES Volume Fact for today

Interesting Action Today

Something happened today that threw me off track and helped shift me into taking more Short trades when my trend indications were actually saying "go long." This was the Volume Breakdown Delta Accumulation indicator. For those that do not know what it is, it is an indicator that can categorize or break down the volume traded to show if there is more buying pressure or more selling pressure.

Background

In the chart below I have added two versions of this indicator that I will reference from time to time in my other posts.
  1. Volume Breakdown Delta - The difference of the buy and sell volume for the current candle.
  2. Volume Breakdown Delta Accumulation - A running total for the above VB Delta.

I use the Up Tick and Down Tick option instead of the Bid and Ask option to calculate my Delta values. Both options produce very similar results, but I have found the Up Tick and Down Tick to suit my tastes better and provide fewer "fake out" moves. Usually the Delta Accumulation tracks reasonably well with price action. Meaning both values will make higher highs or lower lows together. When there is a difference or divergence, I feel the Delta often leads the price action in the turn. Nothing is 100% and focusing on the "short term" can be misleading if you don't also step back and compare with the "bigger picture" of price action.
So What Happened
Just look at today's price action compared to the VB Accumulation (VBA). I marked two areas on the chart with Pink trend lines. In both cases the ES made higher highs while the VBA actually chopped it's way lower in the first example and chopped relatively flat in the second time period. Also note the light Blue trend line showing how the ES Price put in a series of higher lows and the VBA put in a series of lower lows.
Once we got past the opening candles of the session, the VB Delta Accumulation drifted lower below the zero line all day. The horizontal Red trend line across the top of the VBA indicator is to highlight where the zero line. Note that while the ES put in new highs, the VBA went up, but still stayed below Zero.
What Does This Mean
To me, the "Big Players" are being sneaky about liquidating their long position that they have built up in the persistent up tend we have been in. They are not being aggressive and coming down in price to sell at the Bid. Instead they are letting new buyers lift the price to take out their long position.
I'm not trying to call a top and I wont call tops and bottoms. I job is to "trade what I see" and follow the price action as it unfolds. I do suspect there could be more price correction on the horizon, but it may just be another 1-day sell off like we have had recently and right back to the "Bull races" again.
Trade Wise, Trade Well
John

Slam-A-Rama Day

Another quick post... Well I'll actually try to make this one quick for a change as the last ones seemed to go on fairly long still.

How Today Went

I'd have to say today was a hard day for me to trade. I'm still struggling to terminate some bad habits that have resurfaced and hurt my trading the last couple of days. Combine that with the choppy back and forth price action and it was easy to find yourself on the wrong side of the "micro" trends in the day.

Volume started out lighter than the 15 minute average. So the choppy price action was not a surprise, I just did not compensate for it in my trading. I had a good start catching an early short that started working right away. That is until I tried to let the trade run, it did not. That sets the mold for my trading today: Trades I let run did not and trades where I protected profits stopped out for little to no profits before offering additional profits.

Trade Narrative Summary

My trade setups take some price action in the current session before an entry can be defined. Some days a setup can form sooner than others. What I need to do more is look to my 5 minute chart for clues to the "micro" trend direction. This is the direction that I should be placing my trades in until I have some profits to risk for a counter trend trade entry.


So to attempt to make this talk through faster, I'm just going through my 5 minute chart for trend changes. You can see these trends as the light blue lines draw on my chart. By 8:50 CT the initial trend was defined as leaning down. It started real slow, but ran for a couple of points of potential profits. Then there was an up trend after 9:00 CT. Or should I say the reaction off of the Leading Indicators report that was released then.

Coming up on 9:30 the third "micro trend" was turning back down and then right back up again around 10:00 CT. Price spiked up over 1519 and quickly reversed. The one minute chart was warning about the trend change first and the 5 minute confirmed about 10 minutes later.

A little after 12:30 C T the sixth micro trend of the day was back up and held to the high of the day. The volume from 12:55 CT through 1:15 CT was very light, but building. The direction "Tell" was muddied because both the declining and the rising volume was increasing.

Our final trend was back down. There were some early warning signals that the high may not hold, but the trend was finally confirmed down by 2:30. I took a good short entry as a counter trend trade, but did not manage to hold long enough and was knocked out for a small profit that could have been 4 to close to 6 points if held late.

Lessons Learned or Still Needing to Reinforce

Quick list for today.
  1. Maintain Focus Better - Today was not a day to lose focus as the market would turn as soon as you looked the other way.

  2. Don't Force or Chase Trades - In a choppy market there are often multiple chances to get into a trade. Don't rush into a trade at a less favorable entry price.

  3. Watch ALL the Clues - I need to train myself to keep "cycling" through a review of my charts to help make sure I'm seeing all the continuation and warning signs. For a choppy day like today, the warning signs of a potential turn are critical times to protect unrealized profits and tighten stops if appropriate.

  4. Have a list of Report Times - As a pre-market ritual, I'll review when major reports are coming out for the day. I do need to be better at watching the clock for these times. Maybe I need to set an alarm as a reminder. When the Leading Indicators came out I should have protected my profits in my short trade and possibly tried a scalp entry long to see if it would hold.
Trade Wise, Trade Well
John

The Hardest Part of Trading

Don't Underestimate Psychology in your Trading

I know I sure did. I felt I was a "level headed" individual that did a great job at keeping my emotions in check in everything I have done in my life. Well let me tell you for some reason trading is different. I'd also have to admit that I was great at keeping my "outward" emotions in check. So I would appear calm and collected in difficult or emotional situations, but the emotions were still inside trying to cause me issues.

What Got Me to Focus on This

Last night I was looking through some Blogs that I don't normally visit. I was not really looking for anything specific and at the time I did not track these blogs as they did not seem to complement my trading style or needs. But I discovered a couple of comments that stuck in my brain about the "Pain of loosing Money"
  1. For most people the pain of loosing is greater than the joy winning the same amount.
  2. Making losses is painful enough. Especially if you knew better and could have avoided them.
I think point number one really speaks to why the "Fear of Loss" is such a big problem for new traders. People would rather "not loose" than "win" given a choice. While similar they are far from the same. Another way of saying it would be to give an example based on a running race. A similar statement would be one of the athletes in the race saying I don't have to finish the race in first place as long as I don't finish in last place. By not coming in last place, the athlete is not loosing.

How does This tie to My Trading

I can say that I had a big problem "over protecting" good trades where I would crowd the stop too quickly and placed it at break even just before the trade goes my way. Because of the fear of a winning trade becoming a loosing trade. When I have not even given the trade time or room to work for me. On the flip side, I had had no problem holding onto loosing trades, "Hoping" that price turns and the trade becomes a winner. Only just delaying the loss until the stop would get hit when I should be evaluating if I should be in the trade and exiting as soon as I determine the trade is not what I wanted. Or at a minimum, checking where the "tightest" spot I can place my stop that still allows the trade a small chance to turn into a winner.

For some reason this all came together as I reviewed Dr. Brett Steenbarger's recent Post. I followed the link to Dr. Bruce Hong's new Blog. While reviewing his posts on trading Psychology I came across his post on The Beginning: How memories are formed and it really struck home for me. Dr. Brett had spoke about the need for repetition to really learn or ingrain a habit into your brain to get to the point where you react the same way each time to the same event. While it made perfect sense to me, it never combined with my bad habits I needed to break.

My recent frustrations with my trading the last two days needed to combine with this information. The following quote from Dr. Bruce's post is what struck home for me:
"Good habits and skills take a lot of time, effort and repetition to acquire. But so do bad habits! They don't happen overnight - you have to really do a lot of work or repetitions in order to acquire bad habits! And once formed, they're in there forever!"

Still wondering what the big deal is?

I have "Learned" some very bad habits that are still appearing in my trading. They have surfaced with a vengeance these last few days. I'll have to correct these or I'll not be able to finish my transition to a profitable trader
  1. I started by questioning my new signals as I was attempting to define a new trading edge.
  2. while in simulation mode, If I missed an entry I would Sim a late entry as a lazy was to "log" the trade.
While these so called "late entries" were never profitable in my simulation trading, I keep taking them to log the trades. Then when I reviewed the trade log, I knew I could tell where I should have entered the trade. I think this has had the side effect of repeating a bad habit so much that it is too easy to fall back into this mode even when I know it has never worked.

What Does This Mean to My Trading

Simply put - Don't chase missed entries. Wait for the next entry. More often than not, the next entry will even provide a better entry price then "jumping on" late to a missed signal. This is my number one priority right now.

Technically I should never chase. If I'm following and "Trusting" my signals I should be catching several nice moves when they are offered. The only time I can allow myself a "late entry" is when price is coming out of congestion and is giving every sign that it wants to run away. Just don't force these entries.

Trade Wise, Trade Well
John

Wednesday, May 16, 2007

Bullied Around

Another quick review as I need some more time to regroup again today.

How Did It Go

Well... At first I felt a little bullied around by the market. With some light volume periods, the market seemed to bob around more on me. As the day went on, I started to realize that I was the bigger Bully. I was being my own worst enemy and beating myself today more than the market was beating me.

For some reason I would question my entry signal and not take it. Then I may even not take the next signal on the same trend move. Then I fell into bad habits. Too many trades. Worse yet, too many of the trades were "jumping on late" in a move where I had little hope of capturing much profit. Actually trying to hold onto these trades often ends up being small losses instead of winners.

Yet for some reason I I can get into a mode where too many of my trades are like this.

Summary Trade Review

Here are some thoughts from the notes I typed throughout the day.

Initial probe – My initial trade was best described as a probe for market direction. It was a long trade based on a new setup that I'm still working on perfecting. The signal quickly informed me I was wrong. By acting quick I was out for only a couple of ticks loss.

Lets try that again - Only short now. I missed the Declining issues making a lower high and turning down. If I saw that sooner and acted on it, I would have taken +1, +1. I missed, and slightly did not trust the re-entry at 1511.00 and I’ll take my do over on that trade. Then lets not talk about my favorite blow a trade @1509.00 price level. How many posts reference a trade I should have taken at 1509.00?

Revenge Trade – Don’t do it, walk away. Do anything other than a revenge trade as they rarely work for positive results. To make matters worse, my short at 1509 is also classified as a counter trend trade by my measure of short term trend direction. :-( I should also have seen the 1 minute buy volume at 10:32 CT as a big warning too. What was I thinking, oh... that’s right you don’t think right when you put on a revenge trade. Well there is a loss for all those 1509 trades that would have been winners. I bailed as fast as I could on this one, but damage done as the market took off FAST to the up side.

When price had troubles getting below 1506, I should have bought. I had that area as the prior weeks Value Area Low and flagged as a high importance area. Also NOTE – The low at 1506 was 1 tick away from the low defined by twice the price range created by the first hour of trading. Hmmm… Still trying to figure out how best to profit from this occurrence. Any thoughts or ideas let me know.

Saw that one coming – Saw what I figured would be a fake double top. Price action did press higher and I got short on my entry confirmation. How ironic, if the market puts in a fake double bottom at 1509. So tempting to take 2 points here, but I still like the short side right now. We will see. Well... when I started seeing more sustained buying on the up ticks than selling on the down ticks, I should have exited the second half @ +1.5 points. But price did not seem to want to go higher. So I felt price could go either way and I tried to hold on. After price stated bumping into 1510.25 I waited for the Bids to dry up and then covered for +1 point.

On non-trend days, like I'd classify the morning trading for today, I have had really good luck fading the NYSE Tick extremes. The morning High above 1513 @ 9:14 CT, then the low that touched 1507 @ 11:44 CT are good examples of these trades. I feel these are examples of when the Market is probing for stops and trying it's best to force people, you and I that is, out of trades that favor the direction the market is going. Why did I not try a long above 1507? When the market had no troubles powering to a higher high I should have been only taking long trades from this point on.

I was lulled into losing track of this important detail. The market consolidated for over an hour to help me lose my focus. I'd have to admit that the market did "it's job" on me today. That is to keep me looking the wrong way and not "seeing" what the plan is.

It is always easy to see in hindsight, but I had what I classify as 4 "Must try" long signals in the consolidation period. But doubt and hesitation chopped me up instead. Properly executing my plan, I would have capture no less than 1 point on each of these trades.

Lessons Learned or Still needing to Reinforce

Too many to list today. But I'll give it a try.

First and foremost is to trade my plan. I have only given hints so far in this blog as to the triggers for my trades. If you have not reviewed any trades in detail, I'd have to admit that this is a very aggressive trading style. When I screw up like yesterday and today, it can really hurt profits.

I pulled back yesterday, but today I'm down in more ways than one. Down about how bad I followed my system and down in the P&L too. I must just blindly start taking my trades, no second guessing. This is leading me into the the "missing out" feelings that eventually get me to "jump on" near the end of a move "Hoping" that it keeps going.

My purpose for this blog is to get the "Hope" out of my trading and stop using "Hope" as a trading discipline.

One other item I noticed about my trades today. I have two options for the second half of my entry.
  1. Grab Maximum profits for the "Swing" I'm trading.
  2. Be willing to risk the second half profits in order to hold for the "bigger" move.
There are many factors that make this a complex decision. Some of the things that come to mind are as follows:
  1. Entry Price - How good is the entry price. Expect the market to test most prices at least once. Often before a bigger move, it seems that the prices are tested two, three, or more times.
  2. Support and Resistance - Are there any "key" levels near by that price may react off of that could bounce price back to entry. This includes: Pivot levels, Market Profile Levels, and recent highs and lows (for today, yesterday, and overnight as well)
  3. Price Action - Choppy day or trending day
  4. Volume - Is volume increasing in the move or decreasing. Expect counter trend moves to occur with lower relative volume.
I know it is not a "easy" formula, but one that is well worth figuring out.

Today I think I got too caught up in the immediate price move and did not "step back" often enough to make sure I was not losing sight of the big picture. I also had troubles "trusting or believing" the bigger picture when I should have "blindly followed" my system to execute my plan.

To put it simply, maintain discipline and trade the plan. No second guessing.

Trade Wise, Trade Well
John

Tuesday, May 15, 2007

What a Day

Sorry, I'll have a quicker than normal post for tonight.

Summary Trade Review

I got off to a really bad start today. The first couple of trades I wanted got away from me. The first was an early short at 1511.00 within the first 15 minutes of the market being open. Then I was really interested in a long near 1509.00 to 1508.00 area. You may remember the 1509 area from earlier posts. I have let too many trades get away from me that were in this area.

Well... To make up for mentally missing these trades I started trying to call the top. I quickly dug a pretty big hole for myself.

I eventually saw the light and got long at 1514.00 shortly after 9:00 CT, not a preferred entry, but better than trying another short. The market quickly went a point in favor and stalled. I took the first half off as this was not a "good" entry price and had a high probability of hitting my stop even if the market continues higher. I got lucky and harvested 3 points off of the second half.

Believe it or not, but I'm still in the hole. :-(

Then I went for a short at 1518.00, I should not, but the signal was too good not to try. The market tried to get me to bail, but I held on. As a counter trend trade, I took the first half off at +1 point, then I captured 2 points on the second half. Hey... I'm back positive on the day, but need to pay commissions still..

Then I got stupid again, took some "poor" signals. Both a long and a short and dug back into the hole again. This exchange made me miss the second drop just before 10:00 CT. I did catch the pull back and scalp a point back to the swing low around 10:12 CT.

Then I felt the need for a couple more "dumb" trades. I really need to stop this to get somewhere, other than back into the hole again that is.

I stood aside for a little while to better figure things out. Hey, I think I figured it out, we are going back down. So I doubled the contracts. the bad news is I did not get a "good entry" again, I'm short from 1513.75 on the Jump-on entry.

I tried to hold on to all the contracts. As price approached the 2 point target for the first half position, I moved the stop to 1 point to make sure I harvested no less than that. Well, the stop took the first half off at 1 point. For 1 minute, price touched the +1 point stop but went no higher. A looser stop would have allowed more profits. :-( The second half was bumped out at +2 points. All on double contracts. I would have been done favor the day at a max stop loss if I was wrong on the direction. There were signs earlier to get short above 1516, but my head did not clear fast enough.

Had a couple more trades where I lost a little and then made it back. Saw what I thought was the "next ledge break" forming after 1:30 CT. I decided I needed to stop as I was getting "too wild" with my trades.

How I felt

I think I revenged traded early today. I can tell you that it did not help, and I'm sure I can say that it hurt in several ways.
  1. Making bad trades starts to wear at your confidence.
  2. Then you start questioning the next signals when you should be reacting to them.
  3. Breaks your Discipline and snow balls into more bad trades.
  4. Get some bad trades that eat into profits (or make losses)
  5. May get some winning trades, but entry is later in the move and not a level that can easily be held for larger profits.

Lessons Learned

Too many of my trades today were of the "jump-on" variety. This is where I see a move starting and I try to join it as early as possible and risk that price may make another stop run higher or turn and reverse directions. I have two stop choices here.

  1. Tight, will be hit if price does not reasonably continue.
  2. Loose, Risking a larger loss if I'm wrong on the price direction.

While several of these trades worked for nice profits, many others also produced losses that made today not very good of a day. Since price kept moving today I was able to "earn my way back" again. Without these moves, it would have been a different story.

I did figure out some signs using the Volume Break Down Delta, or difference between trades on up ticks minus those on down ticks, that helped me stay in some of my winning trades and should have had me bail on the position that turned into losers. I may end up doing a post on that sometime by itself. I'd classify it as more of a scalp entry where some profits would need to be "taken off the table" to lock in profits and additional contracts could be allowed to run for more profits.

Trade Wise, Trade Well
John

Monday, May 14, 2007

Interesting ES Fact for Today

Market Observation

I forgot to point out one interesting item in my trade review today. This happened in today's price action, but don't get real excited as this does not happen everyday. I'm trying to study it and see what I can discover.


What is it

The Low of the Day came in, to the Tick, at twice the range of the price action within the first hour of trading. Above is a 5 minute chart of the ES emini. There are three bands on color that show on the chart behind the price action.
  1. The narrow green band, is a 32% to 68% range of the first 15 minutes of trading. I use it to help me determine early directional trades.
  2. Wide green band - represents the price range of the first hour of trading.
  3. Blue Band - Twice the range of the first hour of trading.
Check out that low. Interesting, but need to discover how to use this when it does happen. The reverse can be true as well. That is, a high can come in at twice the range of the first hour of trading. On a choppy go-nowhere day, the price action can stay within the range developed within the first hour of trading.
Trade Wise, Trade Well
John

Good Start

Monday 5/14/2007 ES Futures

How it Went


Good Start, then all down hill from there.

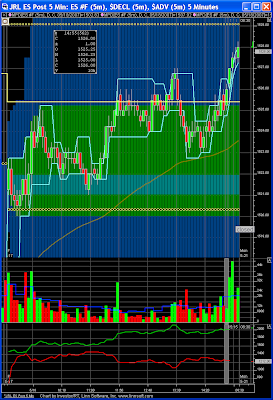
Price action covered a 14 point range and never hit R1 or S1 due to the large range last Friday.

I was left standing trying to figure out how I could be both too aggressive and not aggressive enough all at the same time. Well, that is how I feel about today’s trading. I felt good about most the trades I took, but two bad trades and some bad stop management cost me having a good day today.

My Trades

Trade Pos. Enter $ Exit $ Enter Time Exit Time Result
1A Short 1512.75 1510.75 5/14/2007 9:09 5/14/2007 9:20 2.00
1B Short 1512.75 1510.75 5/14/2007 9:09 5/14/2007 9:28 2.00
2A Short 1510.50 1511.50 5/14/2007 10:32 5/14/2007 10:38 -1.00
2B Short 1510.50 1511.50 5/14/2007 10:32 5/14/2007 10:38 -1.00
3A Short 1511.75 1510.75 5/14/2007 11:51 5/14/2007 12:21 1.00
3B Short 1511.75 1511.50 5/14/2007 11:51 5/14/2007 12:26 0.25
4A Short 1509.50 1507.50 5/14/2007 12:36 5/14/2007 12:45 2.00
4B Short 1509.50 1508.00 5/14/2007 12:36 5/14/2007 12:47 1.50
5A Long 1503.75 1502.75 5/14/2007 13:17 5/14/2007 13:18 -1.00
5B Long 1503.75 1502.75 5/14/2007 13:17 5/14/2007 13:18 -1.00
6A Short 1505.00 1506.00 5/14/2007 13:27 5/14/2007 13:29 -1.00
6B Short 1505.00 1506.00 5/14/2007 13:27 5/14/2007 13:29 -1.00
7A Long 1505.25 1504.25 5/14/2007 13:38 5/14/2007 13:43 -1.00

My Take

First Half: 1.0 Point Second Half: -0.25

I feel I could have/should have captured 7 and 5 points today (or more). With my same trades above, just better stop management would have made all the difference. Add to that another 1 point for each "half" just for me to not take a "stupid" trade.

Trade Narrative

I started out not aggressive enough. I was looking at a possible short at lasts week’s Value Area High. Short 1515.50 plus or minus. I backed off when price sliced through almost 1 point. This area was also a retest of the overnight high. Ended up being the high of the day.

My next short signal was just under 1515 and ran away from me as I waited for what I'd classify as a clearer signal.

1. In a Trade - In early at 1512.75 as I used a signal that formed within a 1-minute candle. At the close of the candle the signal was “not as good” as intra-bar. But the trend is continuing and I did not take much heat.

I took the first half off at a standard 2 points profits as that was a little above the Value Area High from last Friday. Almost did not take 2 points on the second half, but when it appeared that we would not get initially through Friday's VAH I took 2 and ran.

I passed on the next two short signals. The first would have been a scratch trade, but the second would have captured 1 - 2 points each half.

2. First stupid Move - Tried to "short the negative Ticks as a "go with" the trend trade. I held too long and even had a late chance to bail at break even and did not take it. I either should have not entered this trade or I should have bailed much earlier when there was not follow through.

3. Good Read or Lucky - You will have to decide for yourself on the title. I was too aggressive on the entry, I had all day to get short at 1512.00 and just went short quickly a tick lower. I had to hold on for 25 minutes for the trade to go somewhere. The 1000 Volume and the 233 Tick charts helped me hold on to this one.

This is BAD STOP placement 1. For some reason I placed the stop at BE + 0.25 for the second half. Well I have to say it, but I was out TO THE TICK at the swing high. To make matters worse, I think getting stopped out and having to re-enter the trade at a lower price kept me from getting back into the trade.

4. Jump On - I did jump back on as it looked like we were tipping over. Price came back a tested my entry and I held firm. I took the first half profits at 2 points again. Something possessed me to get aggressive on the stop for the second half. I wanted a better rally to get short off of again. But if did not come. I missed another 3 - 4 points by not just holding the prior trade longer.

5. Really aggressive - Having missed out on the Short side, I decided to take an aggressive long signal. I felt strong that we had a good chance of making a bound here. The problem is that I got too aggressive with the stop placement too. BAD STOP placement 2. Out to the Tick again, and the trade is working. :-( If I have waited for the close of the 1-minute candle I would have entered at a better price and believe I would not have been stopped out. I must give a wide stop when entry price is not ideal.

6. Extra Trade - If the long position would have "stuck" I'd be long and would have passed on this short trade. With the strong Buy Volume, I should have passed on this trade. Tight stop, but another looser. :-(

7. I did it AGAIN - Liked the long again, but the darn stop got too close again. I can not believe this is the third BAD STOP placement for the day. Out to the Tick again. on another trade that would have made some profits. That hurts, again.

Thoughts About Today

I killed my profits today. Two "mistake trades" that I should not have taken hurt, but what hurt the most was having two long trades that I was “right” about, but an extra stop run took me out to the Tick. Granted my stop was too tight as well, but that hurts the pride.

Lessons Learned - Or still needing to reinforce

Sometimes it can pay to get aggressive. I have felt that I have been passing on a lot of opportunity by trying to primarily take signals with the trend. I got aggressive this afternoon as I "missed too much" of the move with the trend.

The lesson is that I should not get too aggressive with my Stop Placement as that rarely pays. My usual line is not to move your stop until you are willing to get taken out of the market at that price. I need to listen to myself sometimes.

Trade Wise, Trade Well
John

Friday, May 11, 2007

Pinball Today

Friday 5/11/2007 ES Futures

How it went

This is how I feel about the week. Too many mistakes this week, and I'm not where I want to be yet.

Today was better, but I’m still not being crisp with my trade decisions. I’m getting into the moves at secondary entries and not leveraging the Market Profile and Pivot levels like I should. Today's price action "felt" like we were knocking a pinball around.

Trade Log of My Trades.
Trade Pos. Entry Exit Entry Time Exit Time Result
1A Long 1504.75 1505.75 5/11/2007 9:38 5/11/2007 9:48 1
1B Long 1504.75 1508.75 5/11/2007 9:38 5/11/2007 10:04 4
2A Long 1508 1507.5 5/11/2007 10:21 5/11/2007 10:25 -0.5
2B Long 1508 1507.5 5/11/2007 10:21 5/11/2007 10:25 -0.5
3A Long 1507 1506 5/11/2007 10:48 5/11/2007 10:51 -1
3B Long 1507 1506 5/11/2007 10:48 5/11/2007 10:51 -1
4A Long 1506.75 1506.75 5/11/2007 11:31 5/11/2007 11:47 0
4B Long 1506.75 1506.75 5/11/2007 11:31 5/11/2007 11:47 0
5A Long 1507 1508 5/11/2007 12:05 5/11/2007 12:26 1
5B Long 1507 1507 5/11/2007 12:05 5/11/2007 12:48 0

My Take

First half: +0.50 Second Half: +2.5

Trade Narrative and thoughts about My Trades
My setups take some time to develop in the morning. It is usually 20 – 30 minutes before my first trade. I do my best to place the first trade in the direction with what the initial trend. I’d call this the first Micro trend of the day. So I resisted shorting the Pivot. But I saw it in real time. :-) And it was a decent trade. :-(

I’ll be doing more pivot research this weekend. If I add some hind site to the evaluation, the 1505.50 was also a Market Profile levels as well that the bears should try to hold. That should have put the Pivot short in the must try category for today.

Trade 1 - Had a “weak” long signal at 1501.50 and I was just a little late to catch it. Then when we broke above the Pivot, I should have got long there. I had two signals as price was bouncing on the pivot and then a third just under 1505. Technically I jumped in long just ahead of this signal. I though I saw the signs of the market wanting to take-off to the upside. I almost bailed when price hesitated for a few minutes, but then I saw the next long signal and decided to hold on. Yes, I did bail on the 1st half a little early, but I’m happy with what I got out of the second half.

Trade 2 – I was not real excited about this trade. I was going to pass on playing the short side of any retracement right here. But for some crazy reason I jumped into this trade at an aggressive entry. I touch of patience and I’d have entered a half point better. It still would have been a scratch trade, but not a small loser. I bailed quickly on this as I wanted to seem more strength or I felt price was going to retrace more.

Trade 3 – Did it again. Got in at too aggressive of a price point. This is a slow part of the day and there was not a reason to rush. I had another Market Profile level at 1505.75 and I think I was trying to get in there for a bounce. Right idea, but as I chased the entry and did not wait for a “back and fill” that the ES is known for to enter on.

A real touch of the price level was given and I don’t believe where I placed my stop. Usually I have at least 1 tick and often 2 below the last swing low. A stop there was inside my risk tolerance for this trade, but somewhere along the way I tightened the stop and now I’m out in the Stop run. :-(

Walked away to clear my head. When I got back I felt I missed the 11:10 CT touch of 1505.75 to get long. Missed the second touch too about 5 minutes later. It really looks like this area could hold.

Trade 4 - I took the next signal and now I’m back long at a higher price again, Touched 1 point in favor, did not fill my close target for the first half, I decided to protect at break even and almost immediately after moving my stop price slammed lower fast. Out at BE.

Trade 5 – While I was trying to see if “I missed something” and if I thought price was going lower or higher right here. I decided that that last Slam down on price that took out my last trade was a stop run and I still believe price is going higher here.

To me it looked like a pattern I have seen before. Where before making a significant price move (in this case higher) there is a "show of strength" in the opposite direction and like before a “1 Tick lower low” is put in before going higher. To me the “real low” was put in just before 11:00 CT and the price action for the next hour was just playing and trying to get people to think price is going lower.

Long story short, I’m long, but for the third time missed the entry I should have had. This one will hurt if I’m wrong and price is not going higher. (My pride is what will get hurt) The biggest risk is that the afternoon just gets choppy and I’m long too close to the top.

The Volume Delta accumulation is climbing. Someone is buying here, but price is holding or dropping slightly if anything. Ticks are holding mostly positive, but I’d like to see a push higher. The “relative highs” in the VB Accumulation compares to prior price highs at this same accumulation level. The time factor is starting to wear on me in this trade. Finally, here we go. Trailed 1st stop to +1. Out half at +1. Now we wait and see if price is going anywhere this afternoon. Well… Out +0 for the second half. I held my stop at –0.25, the market would touch my entry of 1507, then bids would come back in at 1507.25. That happened many times.

Then I saw the bid number at 1507 jump to over 2000 then go back down a few times. I know the contracts did not sell, but too often when I see that “game” in the Dome, price goes to the number where the “Dome Games” were being played. That spooked me out. Price did finally tick lower, just a lot slower than I thought.

I could have taken the second half off at 1 point (or slightly better) a few times, but I was willing to see if this would hold and go higher for me. With some hind site added, I’d say I should have taken 1 point after 10 minutes of not being able to make a higher high because I got in at a higher entry price. Price dipped down and would have knocked out a trade at the “better” entry as well, but did not make a 1 Tick lower low this time.

Well price did what I thought and pressed higher. Went higher than I might have expected. I just could not hold on, and stopped trying to get back in. Once again I could have made more staying in the game longer.

Thoughts About Today

I still “feel” like I’m not taking my signals properly. I may be looking for reasons to not take a trade instead of looking for reasons to take trades. I’ll have to think long and hard about this over the weekend. I’ll try to comb through my historical charts again to practice better at taking my entry signals.
Lessons Learned - Or still needing to reinforce
Luke, use the “Pivot and Market Profile” force. I must take more trades off of these key levels. Expect price to bounce when first approaching these levels.

I also need to not “Rush” my entries. In a fast market you just need to get in, but still need to be careful about the entry price. In the typical price action, I can benefit from the back and fill nature of the ES and get a slightly better entry.

I’ll be reviewing these as much as I can this Mother’s Day weekend.

Trade Wise, Trade Well
John

Thursday, May 10, 2007

Quick Review Post for Tonight.

Thanks to Yaser for commenting and trying to get me to see the light and to more effectively use the pivots. :-) Check out his blog to see some great reviews and trading ideas. If I get back to trading stocks, I’ll be on his site quite often.

I’m sorry to have to admit that I was “watching” too much as we came down to S1 and my famous 1509 price area I have mentioned before. I almost just bought it, there should be at least some bounce there right. I should have, but did not. I did not even get in on the quick “retest” a few minutes later. I saw it but had a mental block about taking it. I waited for a little show of strength and took the next entry at 1510.25

I needed to step away for a few minutes. So I get a bright idea, Take my first half off and place the stop for the second at BE and don’t worry. Well there was no worry, the market came right down and took me out took me out. To make matter worse, the next entry was missed by a phone call.

Got the third entry – Long it is. After price seemed to struggle to get through the potential Double Top at 1513, I protected the first half at 1 point after a quick pop higher and a slam right back down. Out at BE for the second half.

Unfortunately I only frustrated myself today. Saw too much opportunity and just kept messing up. None of my winners ran more than 2 points, or I managed to choke them out before they did go farther. Then I'd try to let the next one run and get stopped out for even less.

I need to regroup....

I'm trying too hard, filtering too many good entries, and miss managing them ones I do get into. Mix in a few losing trades (a couple that I clearly should not have taken) and I have a pittance for what I could have captured today.

Trade Wise, Trade Well
John

Wednesday, May 9, 2007

Great Thoughts, Bad Implementation

Wednesday 5/9/2007 ES Futures

How it went

Well… Not as good as I would have liked. My morning pre-market simulation trade, see earlier post, just set the stage for today. I wrote off too much of the morning signals and the price action after the FOMC “they” decided to “mix it up” and make a different price pattern. It almost worked, I started wanting to go short. I was too slow to draw my Fibonacci grid on the range of the report price action.

Luckily I slapped that grid on before getting short. The bad news is I let the long entry go by to wait for the next short signal. Now I’m watching the market go up without me. See the dark purple line on the chart.


Trade Log of My Trades.
Trade Pos. Entry Exit Entry Time Exit Time Result
1A Long 1510.5 1511.75 5/9/2007 8:57 5/9/2007 9:05 +0.75
1B Long 1510.5 1512 5/9/2007 8:57 5/9/2007 9:11 +1.5

My Take

1st half: 0.75 Points
2nd half: 1.5 Points

Trade Narrative and thoughts about My Trades
How not to Enter – I settled on an entry price a little higher to get into this trade. Price action did come back and would have given me a little better entry. This worse position made me not hold the 1st half as long as I intend. My thought was to bank some profits and see how long the 2nd half could run. Well... I changed my mind and decided to bank more profits to play with later. Since my entry was not as good as I intended, I decided to try to grab profits and get a new entry. We will see…

Really tempted – I almost tried to reenter my long. I decided it was too soon and too close in price and I did not want a bad "revenge trade" after a profitable trade. Glad I waited now. Volume is very light. I just may end up waiting until after the bomb drops. The FOMC announcement that is. I’m leaning to the up side right now as my guess for the price action after the report. Playing with some Fibonacci levels, the low so far today is around 1509 which happens to be the 62% retracement of yesterday's range. Bears need to break that to go lower. See the light purple line on the chart.

Three signals to buy at the Pivot when it was holding there for 20 minutes. I wanted to see a press through the pivot to hit stops. That would have definitely enticed me long for sure. Too late, drew the Fib for the day’s tight range so far. The Pivot just happens to be the 62% Retracement level and need I say it held – so far it is off to the up side.
Thoughts About Today

I need to stay in the game better. I could have done much better if I took some more trades with the plan to bail on the trade if the price action died for too long. There were definitely some dead spots, but I was on the right side for the trades I wanted to take all morning.

Just left that money on the table for someone else. :-(

After my comment about 1509 being the 62% retracement of yesterday’s range, I wanted to just place a “buy order” there and see if the market slammed down and hit it with the FMOC announcement. Would have made for a great trade. And somehow (much later in the day now) I started thinking short. Instead I should have seen the stop run below today's low and jumped on early to the up side. Live and learn.
Lessons Learned - Or still needing to reinforce
I need to stop trying to make up my mind for “what the market should do” and trade what I see.

I wrote off the morning as not good trading. While it was not the best I feel I should have taken more trades. Easy not that I see they worked. :-) Maybe these trades would be higher risk with the lower volume and tighter price action, but there were trades there that worked for decent profits.
I'd like to hear thoughts from others - am I better to stay out or jump into the fray more?

I either have to take some more risk or be content waiting for the “perfect” setup to occur. Knowing myself, I feel I need to get in there with more trades. Seems like days where there has been an “additional stop run” after my entry will repeat this scenario on future entries. Quieter days have not been putting in this additional move.

Trade Well, Trade Wise
John

Right Idea, Wrong Implementation

Just playing in the pre-markets

I have struggled more trying to trade in the "after hours" market price action. This morning when I warmed up the charts I saw what looked like the 1509 area in the ES could be wanting to hold as the low of the pre-marjet trading. So I decided to Sim a trade to see what I might have done with this trade.

I did a few things wrong.
  1. I quickly took the trade when I first sat down to the charts and did not evaluate price action first.
  2. I took an entry at 1509.75 as it looked like price was "walking away from my desired entry.
  3. I placed my stop "tight" and at an obvious spot, 1 time below the low.
  4. I also started reviewing blogs and not closely monitoring my trade.
What should I have done.
  1. Taken my time to better evaluate price action and how price was moving.
  2. Waited for a preferred entry or let the trade go.
  3. Allowed more room and not placed my stop so close. I actually like to give several ticks of room for "stop runs"
  4. Maintained focus on the trade.

I almost jumped back in after my stop got hit as it felt like a probable stop run. Well the trade is now doing good enough that I can say it would be a small winner at worst case.

Trade Wise, Trade Well

John

Tuesday, May 8, 2007

Not My Best Day

Tuesday 5/8/2007 ES Futures

How it went

Not a good day for me today. I started out thinking good. My initial read was to get short, but I did not find setups that I liked. Then my signals started telling me to try some long trades. Here is where I got out of synch for today. I found myself still “wanting” to be short.

On the positive side – I was able to develop my average volume indicator. Please review my earlier post for more details. I’m sure it is hard to see the finer details, as is the rest of the chart (but until someone asks for better…) details. It’s the Blue line in with the volume.

While there are 1-minute spikes above the “average volume” level, you can see plenty of space more often than not between the Average level and the top of the volume bar. This tells us that volume was lower than average again today.


Trade Log of My Trades.

Trade Pos. Entry Exit Entry Time Exit Time Result

No actual trades. :-(

Trade Narrative and thoughts about My Trades

To start today - The NYSE Tick was the weakest that I can remember for some time now. That had me “anxious” to find a good point to get short. I could have settled for a couple of “ok” short entries, but nothing jumped out and said “get short here” to me.

I wanted to short just above 1510, but I did not have a “real” signal yet. So I waited. Darn, that trade is working. Then price consolidated just under 1509. Again I wanted to be short. I was "hoping" for a “head fake” to the long side so I could short that move, but we never got one. Looks like I still need to get ride of "Hope" in my trading. :-(

As my feelings of “missing out” started building I could tell I was not thinking as clear as I need to be. Now I start getting overly cautious wanting to make sure my “read” was correct and that my “emotions” are not trying to get me to take the “Hope” it works entry signal.

Trapped by the 62’s – Two 62% Fibonacci retracements that is. The first is drawn from the high after the open down to the low of the day. See the dark purple line on the chart above. The second was from the low of the day up to the swing high just before 10:00 CT. See the light purple line on the chart.

Price was trapped for over an hour and a half. I had a caution light, but my signals were telling me to try some long trades. There were too many signals for me to not try any. Either long or short, I should have tried some entries. Obviously the long side won out in the end. Big surprise right.

When price broke to the upside, we received the first NYSE Tick reading above 900. Now lets see if this is a sign of strength or the last stop run before going lower.

Sim it is - That is it. I’m going into simulation mode so that I’ll at least take some trades. I’m a little leery of a long here, but I should have been taking long entries for some time now. Will it continue? I have to get myself in synch. Sim long at 1512 shortly after 13:40 CT. Well… I got over protective when NYSE Tick pressed to highs twice and price action could not get moving back to the up side. Out at break even.

Forcing it – That last trade was a long signal, but I had warning indications of a possible turn and now I feel I should have been short instead. Am I just forcing myself to pull the trigger now? I try to minimize trades this late in the day, but since it is sim and I’m primarily trying to get back in synch I’m siming a short at 1512 shortly after 14:00 CT. When the NYSE Tick slammed down to a low at 14:09, shot back up at 14:10, and price had not done much I decided taking dumb trades late in the day would not help. Just close out the trade.

Done for the day. :-(

Thoughts About Today

Muted price action had me off today. Price did move, but I felt the swings were tighter than I like to see. I feel this contributed to my feelings of wanting to see better signals to take trades.

After passing on some questionable signals that ended up working I became more conflicted. I was having a harder time distinguishing a signal I should take from a signal I “Hoped” would work and wanted to take. By the time I figured out the trade I wanted, no “decent” second chance entries were offered. All I could have done was “Jump-On” the move.

I’m starting to think I have too many “unfiltered” indicators on my chart. I know I can not take all the signals (red and green arrows and dots on the chart) as trade entries. But I’m filtering too many out and I still have more signals that have not been coded into an indicator.

That said, I definitely need to get into more trades. Nothing ventured nothing gained.

Lessons Learned - Or still needing to reinforce

One of the biggest lessons for today is still to trust my signals. As price action wedged from 10:00 - 11:00 CT I started doubting the long side more. My entries are good the majority of times. When I’m “wrong” about the trend either turning or continuing I have a good chance of protecting the trade at or just better than break even or even bailing on the trade for a small loss.

There were a couple of points where I found myself saying I should be in the “last” trade. Right or wrong, I need to take more entries, do not force entries, allow room to work at first, and then be sure to protect the entry when counter trend signals are generated.

To some degree I did a good thing today. When I found myself out of synch and not sure which signals to believe in, I did not trade. I survived another day, I just did not contribute to paying the bills.

Trade Well, Trade Wise
John

Average Volume Implementation

Introduction

I really liked Dr. Brett Steenbarger's Volume and Opportunity in the Stock Market blog post. I had wanted something to help me judge volume levels as the markets slowed down durring the midday action. This makes sense to me, and I think it can payoff in helping me filter my trade selection better.

First Version Implementation

I have completed the first version of my average volume implementation for the ES. The purpose of this indicator is to display a reference line on the chart at the level where volume should be averaging for the current 15 minute period.

One of my goals was to be able to use this indicator on several different time periods. The two primary time based chart I watch throughout the day are a 1-minute and a 5-minute chart. For the "15 minute average" to make sense on these charts I decided to take the average for the 15-minute period and break it down to a 1-minute value within the period. Then I calculate the 15-minute bar period using the following formula:

INT(((SBAR - 1) * MPB) / 15) + 1

The following is a description of the Investor/RT functions:

INT is the integer function
SBAR returns the number for the current bar in the session
MPB indicates the number of minutes displayed per bar

Now I just display the right 1 -minute average based on the calculated 15-minute period. For this to work on multiple time frames I must multiple the 1-minute average by the minutes per bar (MPB) function value.

If you use either Investor/RT or Market Delta (both developed by Linnsoft), I can send you a chart template if you are interested in this indicator.

Side note - The beta implementation used IRT's BARNO function. This was replaced by the SBAR function when I discovered that BARNO seemed to "restart" the bar number value for some reason. I discovered the SBAR function while trying to figure out what was going wrong. I never figured out why BARNO did not work after discovering SBAR did what I needed.

Limitations

Hard coded 15-minute values - For this first implementation I'm not dynamically calculating the 20 day average volume for the period. So my values are hard coded to Dr. Brett's values for now.

Only for 15-minute periods or less - This indicator was not designed to work for charts greater than a 15-minute time frame. I make no attempt to combine 15-minute averages to use on higher time frame charts.

Enhancements

The first enhancement is to add a component to update the 20-day average that is used for each 15-minute period. I do not want to waste calculating time to have the main indicator perform this calculation. There is no need to repeatedly perform this calculation throughout the day.

Investor/RT support a display of multiple time periods on the same chart. I'm interested in using this capability to add the 15-minute total volume to the lower time frame charts. I would also add the "combined" 15-minute value as another reference level.

Next Steps

The immediate next step for me is to review historical charts to get a better feel for this new average volume indicator and see how it can help me in my trade selection.

Trade Wise, Trade Well
John

Monday, May 7, 2007

Not Enticed to Trade Today

Monday 5/7/2007 ES Futures

How it went

Pretty boring today. I was definitely cautious today. The last “pre-FOMC” trading I was too quick to get aggressive an took some signals that caught me in some less favorable entries within the middle of the day’s small range. So when I saw we did not have any volume coming in today I played it safe.


Trade Log of My Trades
Trade Pos. Entry Exit Entry Time Exit Time Result
NONE

My Take

Kept all my account to trade another day. :-)

Trade Narrative and thoughts about My Trades

My signals were mixed today… The NYSE Tick seemed weak with lower highs than I’d like to see for movement to the up side. Price opened relatively flat from Friday’s close, but the Advance and Decline lines had a spread that would normally have me leaning toward a long trade.

Then with the weak volume levels I was loosing interest fast. With the FOMC announcement Wednesday, I was suspecting muted price action. I just hope the entire day is not flat sideways price movement.

Passed on the first one - Could have jumped short on 1515.25 a little before 9:30 CT. This lethargic price action has me just evaluating and trying to pick the setups in real time, but not risking capital yet for today. This trade would have worked. This was definitely the best trade from my entry signals for today. That said, only 2 points could be harvested if I placed a target to take profits right there. Price action only went 1 tick beyond.

I have passed on a few more signals. I was almost tempted to try one because the first trade could have yielded 2 points. Well… all of the following signals since then would have only been 1 point scalp trades or break-even trades if I tried to hold for more profits.

Done for the day.

Thoughts About Today
I think I should be willing to trust the first few signals. Then if price action dies out like today did, along with profits in the trades I tried, then I can stop trading for the day.

The other option would be to go into a scalp mode and close the position after 1 – 2 points. That would not allow any trades to run for bigger profits, but could get some profits on the quieter days. I’ll have to do some more research on this one.

Lessons Learned - Or still needing to reinforce
With no action today there is not much for lessons. I’d have to say that I seem to have learned to be more patient and wait for good entries. Too often in my past, I’d try to “make something happen” and get into more traders. On a day like today that is not always good.

I also did a good job at resisting the feeling that price action may roll over and that I should get short. These would have been bad entry points near the low side of the range. Overall I'm probably better off just watching today's action and not trading.

Trade Well, Trade Wise
John

I'll Second That.

Here is a quick reference to a post today on Dr. Brett Steenbarger's Blog. This post specifically refers to the two trades I wished I took last Friday. Dr. Brett tells why he also feels these are good setups. He also starts one of my homework assignments of researching his "other posts" on Reversals patterns within this post.

More to come.

Trade Wise, Trade Well
John

Sunday, May 6, 2007

Dr Brett Steenbarger Voice Seminar

Before I start my family obligations for today, I was able to get up early and attend a voice conference where Dr. Brett Steenbarger was the presenter. I try to review everything Dr. Brett has to say in his posts on the WebLog on his personal site, his Blog, and now really look forward to new events like this Voice Conference.

I Feel he goes above and beyond at freely sharing market insight, thoughts, and research. I take everything to heart and have been able to tweak and grow my trading from the enormous quantity of market details he shares on these sights.

I'll edit in a link when the recording of the conference is made available for replay. Or just watch his site for the direct post on this great event.

Very Good Conference

Dr. Brett went through some topics that were beneficial to me and my future as a trader. Two "simple setups" were presented. If you are interested, review the replay to get a direct understanding of these setups. The details of these two setups have not and will not be posted. These details are only available from this voice conference.

For these setups, recent market conditions are researched to determine if there is an "Edge" that could be exploited going forward. See a recent example of When Large Cap Stocks Outperform Small Caps. The odds of both successful and unsuccessful trades are presented along with the historical average return.

I found it interesting to hear how Dr. Brett then utilizes this research to place his own trades. One setup had a positive expectancy over the next four day period. Dr. Brett does not just buy and hold for this entire time frame. Instead, intraday trades are placed in the direction that the research shows has an edge. Before entering the trade, current market conditions are evaluated to determine that they support the researched edge.

I could see some similarities in Dr. Brett's trading and my own. We both place a position and "take off" some profits for the "psychological win" perspective of our own trading. Then a portion of the position is allow to run (market permitting) for more profits. Dr. Brett takes off 3/4 of his initial position where I'm using 1/2 the position for my first profit taking.

There are also many differences in our styles. I'm willing to take more entries per day and potentially have small wins, losses, or scratch trades probing for profitable trend moves to trade. Currently I'm not doing research to set any probable expectations for the day or near future. My current goal is to correctly react to the price action as if forms for throughout the day. I need to evaluate if similar research could help my trading, but that is further down the road.

One of the points presented matches my thoughts about trading and can be found in this blog's first post titled: My Start. The point being that every trader needs to find "their trading style" to be successful. One should not assume a trading style is a match to their personality. A strategy needs to be tweaked and become "your own" style. Don't just blindly try to mimic someone else's trading style and "Hope" to become a successful trader. (There is that Hope word again...)

After the conference, I found myself with a new vitality and interest to dive deeper into several concepts from the call.

My Main Take Aways

Review postings - I plan on researching Dr Brett's posting to review additional comments on "Reversal" and "Breakout" patterns. These are post I have read in the past, but now want to re-review to gain a deeper and refreshed understanding. I'm sure I'll have more posts on my thoughts from this review yet to come.

This interest comes from conference comments about "momentum peaks" and their characteristics. I saw an interesting alignment between these momentum peaks and some of my own trade setups. I just may find some additional setup ideas or even trade filters to help reduce losing trades.

Average ES Volume - I want to dust off and complete a prior project, developing an Average Volume Indicator. Dr. Brett calculated a table for the average volume for each 15-minute trading period in the ES (S&P Futures) for the past 20 days. See his post: Volume and Opportunity in the Stock Market. I feel this will help me judge volume much better for my trade setups.

I have stated that I like to see increased volume as price moves in the direction of the trend. See the Volume section of the My Trade Setup posting. Without an increase in volume, price will be more likely to reverse. But as volume falls off during the slower midday trading period it becomes more and more difficult to judge volume. Understanding if volume remains above the average for each time period should help me improve my volume perspective.

Journal - My purpose for this blog is a journal primarily for my own benefit. If others find reviewing my thoughts and asking questions also helps them in their trading then all the better. From my past computer consulting days I often conduced training classes. For me, I found that striving to describe and convey knowledge to others improved my own thoughts and depth of knowledge on a topic.

The topic of a "cognitive journal" was presented in the conference. The cognitive aspect should contain "challenging self talk" that would "interrupt the thought process." The interruption is to examine or re-evaluate the details and help make sure the right decision was made. Also, harmful "negative thoughts" are removed and details thought of in a positive light.

This made me think about my recent blog comment from Friday's Trade Setup Review. I found I had to tell myself in the Flip a Coin section of my narrative that while I wanted to enter a long trade, my recent entry signals were actually Short signals. I feel I actually kept myself from putting on a losing long trade when my emotions were tell me to get long.

So what is the take away... To make sure that this blog covers the cognitive aspect for my own self review of my trades. I'll review the chapter on journals from Dr. Brett's Enhancing Trader Performance book to make sure I'm covering the bases.

I always find excellent trading tidbits in Dr. Brett's posts. He shares his market details with the true intent of helping other traders be successful. I applaud him and also thank him as I have benefited from his sharing.

Trade Wise, Trade Well
John