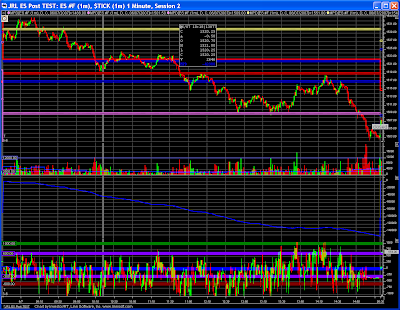
I have my current implementation for Dr. Brett's cumulative adjusted tick indicator that I refer to as CAT. Quick background - CAT is a running total for the current day of the 1 minute NYSE Tick close value that has been adjusted by the average Tick value for the past 20 days. If you are an Investor/RT user let me know.
Not Exact
I had been unable to match Dr. Brett's values as shown in his May 24 post and parked the indicator. I decided to dust it off this week as I have been looking for an indication of trend days to help hold for the bigger moves.
My values still don't match exactly, but are "close enough" for now. You can see how my indicator crests just over the zero line before showing a nice down trend on May 24th, 2007 below. Dr. Brett's indicator never goes above the zero line the entire day.
 Other than the differences in the values, I do like what I'm seeing from this indicator. More historical research is needed to see how this reacts in different market conditions.
 Sample Charts
Down Trend - May 24th, 2007 and June 7th, 2007 are remarkably similar days and show how the CAT behaves on a strong down trend day.

Choppy Day or Mixed day - Today's chart, June 15th, 2007 is a decent sample for a chart that has mixed up and down trends with some choppy periods as well. I found it interesting that the CAT showed a trend into the close, but that price did not follow through.


No comments:
Post a Comment