Showing posts with label emini. Show all posts

Thursday, July 12, 2007

Interesting Internals

Thursday July 12th, 2007 ES Futures

A real Gap and Go higher day. The NYSE Tick started strong but quickly fell back into a weak posture producing levels that would normally occur during a down trend in price. Not the case though, as the ES price kept powering higher for the majority of the day.

I found the market internals interesting today as well. My CAT Indicator was "Out-of-Synch" again for most of today. Similarly, the Advancing issues (ADV) and Declining Issues (DECL) in the chart below did not seem to match the ES futures price behavior either.

The Advancing Issues were relatively flat for the first 4 hours of trading while the Declining Issues kept increasing and increasing for the first 5 hours or trading.

The biggest decline of the day happened when price tested twice the first hours price range. The mystical 2X price of 1549 held initially and price retraced just below 1545. Then the ADV and DECL got in synch with the price action and produced a beautiful uptrend move. I caught the first half of this move. I knew I should have just walked away until near the close of the session, but I had to get cute with my stop and get chopped out (to the Tick) before price continued higher into the close.

Trade Wise, Trade Well
John

Wednesday, July 11, 2007

Here We Go Again? Maybe...

Wednesday July 11, 2007 ES Futures

I did not trade today. Took some family time to to go see the new Harry Potter and the Order of the Phoenix movie at the local IMAX theater. I have liked other IMAX movies, but I left thinking I would have liked seeing this movie from a "normal" theater instead. I still would recommend the movie either way.

Back to the Charts - I found it interesting when I looked at the charts after the fact. Today would have been another "Out of Synch" day. To me, this means my CAT Indicator keeps telling me one thing (today to take short trades), but price is trending better in the opposite direction (today price was up more than down.

Since the July 4th Holiday, it seems to me that the NYSE Tick has been notably weaker. In the chart above, the Tick rarely touches the Green line. In a sustained up trend, the Tick will normally touch and produce extremes above this 1000 level frequently.

I can not wait until tomorrow to see what happens. Will we have a Gap down, will the NYSE Tick still remain weak, will it be a down day, or will price continue higher to the top of the channel we are currently trading in?

Time will tell.

Trade Wise, Trade Well
John

Makes More Sense Now - Delayed Post

Tuesday July 10th, 2007

The NYSE Tick started out extremely weak. It took about 20 minutes for the Tick to get noticeably above the zero line. This weakness is not normal. Price did a "Gap and Go" lower. It was not obvious early in the day as price chop mostly sideways.


Combine today's weakness with yesterday's weak CAT Indicator readings and I started expecting a big down move was highly lickely and that price would not close the Gap. It took a ling time, but Price finally caught up to the CAT Indicator.

Trade Wise, Trade Well
John

Thursday, June 28, 2007

Did It Again

Thursday June 28th, 2007 ES Futures - FOMC Day

Today the CAT Indicator kept driving higher up until the FOMC Meeting, but price was choppy and driving sideways for the majority of this time. This is another case of price having to "catch up" to what the CAT Indicator is predicting to be happening. An earlier posts shows this happening to the short side and today was a good long play example.


I still need to do some more research to verify that this is not just a recent phenonmenon. But I find this a very interesting and so far a reliable clue towards price action produced from the CAT Indicator.

Trade Well, Trade Wise
John

Sunday, June 24, 2007

Late Post

This is a late post since I found some issues with on of my new filter indicators, the Mini ADV. I believe I have my indicator fixed now and I wanted to point out what the CAT indicator showed for Friday.

Friday the 22nd of June, 2007 ES Futures

I found it interesting that the NYSE Tick was very weak Friday. This weakness showed in my CAT indicator as it just kept driving lower all morning. Notice in the following 1-minute chart how the purple line for the CAT stayed much closer to it's down trend line than did either the ES price or Mini ADV indicator.

At the low of the day, all the values were back around their respective trend line drawn off of the lows mad early in the morning.


How Did it Go

I'm still taking too many trades "late" in the move. If I pass on a signal or just miss a trade opportunity I have a really bad tendency to just enter a trade "hoping" the move keeps going. First of all - there is the "Hope" word using to describe my trading. I must get the "Hope" out of my trading. These are not "signalled trades" but I'm having a hard time eliminating this trade for some reason.

Need to Keep Score

50% cost me 1 - 2 points
25% scratched out at break even (still cost commission)
25% profited 1 or more Ticks with one (only one) profiting 1 point

Need I say this put a big dent in profits for the day.

If I entered a counter trend scalp trade and traded the opposite direction of these trades, I think every one of these would have held an initial 1 point stop and hit a 1 point target. I'm not planning on trying this, but I can show this over and over again, but still have troubles not taking this trade. This will change.

Trade Wise, Trade Well
John

Thursday, June 7, 2007

Have You Ever Noticed

Just before a "Big Move"

The following charts display two examples from today's (June 7th, 2007) price action that I'm always trying to be on the lookout for in price action. I have to say I'm just beginning to trade them properly.

Well get to it already

Just before the big moves are made, the market does the best it can to shakeout and fake out as many people as possible. I dialed into the 1-minute chart to show more of the price action.

What Do You Mean by That

Notice the nice methodical "Stair Step" down pattern was from the double top high after 9:00 CT down to what could be a double bottom low at 1527. The second low comes in right at 9:30 CT. Then the market moves up above 1528 and does a head fake lower to get some more shorts to jump in.

Then there is an abrupt detour in the down trend and price drives straight higher. We make another top at 1530.50 price. I'm actually surprised that we did not go at least 1-tick higher as I'd expect some people had stops above the prior 1530.50 high. Enough people must have moved their stops to 1529.50 area. Would your have left your stop 4 points above and stayed in this down move?

Then note what happens on the way back down. Price hesitates at 1529 for those people that want in of this "up trend" we just had. Then price presses a little lower. The people long at 1529 are now "hoping" for price to come back higher and I'm sure a few more people get long at this "better price" before price is crushed down past the prior lows.

Also Note

Be sure to note the high in the NYSE Tick when price drives back up to 1530.50 just before the big drop. The Tick made a "higher high" when compared to recent Tick highs. This could mean a turn back higher, but also often signals the big "stop run" before a return to the prior trend. It is our job to figure out which one is being signaled.

Another One

Look at how complex the bottom is before the market goes nearly 10 points higher. The first low is 1509.00 at 12:42 CT. Then we have step one higher to 1512.50 at 12:47 CT follow by the retracement down to a potential "higher low" just missing 1510 at 12:49 CT. Now notice the 12:51 CT and 12:52 CT candles. A quick slam down and back up again for anyone wanting to get short as there has not yet been a "higher high" yet that may keep some people from getting short.

Price grinds higher to the 1513.50 high after 13:00 CT. Then the move down seemed to me to be a pop up in price followed by a quicker slam lower until we made a lower low. Then price went up 2.5 points, back down 2 points, up 2.25 points, back down 2, and then up 3.25 points. In this big of a down day, who would hold through all of that to catch the long move higher? I did not play in any of that chop.

Look what happened next. Price comes down 3.5 points. 1 Tick lower the the last of the three lows described above. I tried to to get long this last time down.

You What?

I tried to get long at 13:36 CT. If you look at the 5-minute chart, the 13:35 candle had lower over all volume. Call me crazy, it looked like I should try it. Well I did not get filled. Looking at a faster chart (not posted) price dipped below 1510.00 @13:36:23 CT, touched 1509.00, and was back above 1510.00 at13:36:38 CT. I had 15 seconds to place my order. Actually I tried for 1509.50 and price was only below for 5 seconds. I could have gotten in at 1510.50, but that is where I would have taken off my first half trying to let the second run for more profits. With only a few hesitations for people to get short at, price drove straight up 6 points.

Hope that makes sense. Let me know if I should mark up the charts more and what you would like to see as mark ups to help better describe the price action.

Trade Wise, Trade Well
John

Extreme Weakness

Thursday June 7th, 2007 ES Futures

How Did it Go

Better, but still not where I want it to be for a day like today. I caught a couple of the down swings and actually make some profit on a couple long trades too. But I still can do better. As weak as the NYSE Tick was today, I should have shorted anything that even looked like a top.

Why was my game still off today. The price action felt jittery or jumpy to me most all of the day today. I seemed to get transfixed with the jumpy price action and did not focusing on all my tells like I should. It started when I just missed the rocket ride to the long side early in the morning. I took me over an hour to adjust and get a good feel for today. Then I still felt a step behind on many moves.


More Volume Tells

This is a little hard to see in the 5-minute chart but try to follow along. We start by looking at the double top between the 8:50 CT and the 9:05 CT candles. The 5-minute chart then hides the pull back as it is split between the 8:50 CT and 8:55 CT candles. Leaving both 5-minute candles looking Green or up moves.

But notice the volume after the first top. Big drop in volume and reduced again in the 9:00 CT push to the second top. What you did not sell the top, there was 5 minutes to sell 1532.00 or better. Well I saw it, and decided not to trust that signal as we already shot up 4 points on almost unbelievably weak NYSE Tick readings. I added to the 5 minute chart for reference.

Normally I'd expect to see NYSE Tick readings touching the green horizontal line in the chart for price to move significantly higher. See how the first near touch at 13:30 CT started the afternoon long trend.

Next, the 9:15 candle's volume screams short the next turn down. I should have taken it, but the NYSE Tick was so weak that I was waiting for a slight push higher before I shorted. My Volume Delta indicator tried to tell me that was all I was going to get for the move up. I was still trying to get in sync with this very "different" day.

Trade Wise, Trade Well
John

Wednesday, June 6, 2007

One Step Forward, Two Back

Wednesday June 6th, 2007

How did it go

Don't ask... I traded very poorly today. Volume started out good and gave the appearance of a trend day fairly early. I lost count of the number of signals that I should have taken. They all would have been profitable to varying degrees and some were even long trades in the afternoon.


I did get a couple of profitable trades, but gave it back chasing entries on trades I did not get in at the signal.

I really need to start trading my system. In the long run, I will be far better off just trying the confirmed entries with the trend. I'll more than be able to give some profits back on the choppy days as days like this will more than make up for it. Assuming I trade them right.

Note the Volume Tells

Check out the lower volume on the early green 5-minute candles. Especially the 3rd, 5th - 6th, 11th - 12th, 15th, and 27th candle on the chart. They all helped to confirm 4 short legs on the initial press lower. The final was a clue to catch the last half of the second big push ;lower in today's Gap and Go price action.

Then we had the opposite for the 11:15 CT candle: Red candle with lower volume - Time to get long.

Then a harder one. The 11:35 candle with really light volume. But also notice the increased selling volume in the prior candles. I saw it, but instead of getting in, I wanted to see price press closer to 1522 again. This second move down was ugly, but volume was trying to coax me in. I just like to see a better rallies to short into, but I'm starting to be a broken record about not taking signals in tight sideways chop.

Later in the afternoons I often find it difficult to use the 5-minute volume as we seem to be more apt to chop around and the read is not as clear as in the mornings.

Trade Wise, Trade Well
Someone needs to as I have not been recently
John

Tuesday, June 5, 2007

Baby Steps

Tuesday June 5th, 2007 ES Futures

How did Today go

Today was not a banner day for me. I ended up positive, but I definitely needed to take some "Blind Faith" trades to make today deliver the results I would have expected for today. I had four occasions where I found myself saying I should be in a trade, but ended up watching anyway. See the Red lines (first two) for short trades and the green lines for long trades.


I think I'm being overly judgemental about my entries. Last week I found myself chasing price after taking too long to decide that a signal was good. When the market is not trending, chasing a price swing ends in a scratch trade 80% of the time and that requires me to "give up" on the trade before price retraces and would often hit my stop for a small loss.

I'm also trying to press myself to take the signal at the "right time" or to let the trade go after reading Dr. Brett's comments about the replies to his Coaching Project and today's Discipline post. If I had to place myself in one of the categories Dr. Brett describes in the Discipline post it would have to be the volatility category.

It feels weird to me to say the cause to my discipline breakdown is volatility. But I can make an association. The signals I'm passing on too often are tight coils where price often moves sideways for 10 to 15 minutes. Today's first short example fits this to a tee. Price went down 9 of 10 points before we had a rally of more than a point. I had several "confirmed short" signals but passed as I always felt I was shorting the low.

I think a mental association with shorting the low is more apt to be the cause. I feel I built this association by "chasing" entries late. Since price often moves in surges, a late entry will more often then not comes at or near the next "counter trend" signal in my system. Then price usually retraces enough that I have a hard time justify holding on to these trades. On a choppy day, these surge moves are often the head face before price turns back into the chop.

But now I'm in a catch 22. My discipline problem is caused by a discipline problem... Err, lets not go there.

I will say watching the 5 minute volume helped to keep me from taking some counter trend trades. Starting with the first Red candle of the down trend (just before the second high in the double top) at 10:10 CT we had light volume followed by an increase in volume as the trend started down. Then the 10:20 CT candle had lighter overall volume, BUT note that the "Sell Volume" as indicated by the Red portion of the volume bar increased from the prior bar even with the lighter volume.

This afternoon, I found Volume to be a much harder read.

Trade Wise, Trade Well
John

Monday, June 4, 2007

Under the Weather

Monday June 4th, 2007

Did not trade Today

I was up sick too much last night and decided it would be better if I did not trade today. Feeling better in the afternoon, I opened up the charts to see what I missed.


It does not look like I missed a lot. Price spent most of the day in the 4 point Value range defined Friday. Note that we had another one of those interesting days where the Volume Breakdown Accumulation works it way lower while price works its way higher. The last time this happened, while I would not have expected it, we had a nice rally the following day.

I believe when we see this happening that the large players are "lightening" or reducing their long positions some. They just are not being aggressive about it. This has not enhanced any edge for me at this time.

Trade Wise, Trade Well
John

Friday, June 1, 2007

Blind Faith

Friday June 1st, 2007 ES Futures

Spotlight Trade

I have been reviewing my trades even harder recently. I review the trades I have taken and compare the entry timing of my trade with the trade signal. I also consider signals my system has given, but where I did not take the trade. I discovered a consistent theme of trades that were profitable, but I was filtering out the signal and consistently not entering these trades.

When I received a signal while price was "ledging" sideways, I would not take these trades vary often. There was a short trade earlier this day that I should have traded but passed. So when this trade occurred I was more determined to "believe my signal" and take the trade.


To see this pattern, start at the low at 11:50 CT. I had a "counter trend" long signal here but focus on trend trades until I have built up more profits for the day. From this low there was a nice price rally higher followed by a retracement back down to the 1535.00 price.

One quick tag of 1535 and price shot up above 1536. My entry signal came on the 12:08 CT pop higher. Initially I thought I had a "run-away" where the possible trade entry price was too far from the signal. Then I felt that price was "ledging" sideways. Some people call this sideways price action a coil or shelf. Still others would say this is the right shoulder of an inverted head and shoulders pattern. The low being the head in the pattern.

I entered at 1536.00 still having my doubts. Then price did a quick press lower towards 1535 again. I thought to myself here we go, the market wants to test my stop and see how much room I'll give this trade to survive. Then even faster price shot higher again. Can you say blast off!

My first half was out at 2 points. When price seemed to stop pushing higher, I only allowed a few ticks and took the remaining profits off at 1.5 points. I was so elated that I took this trade and it worked that I missed the re-entry at 1537.00 as price retraced back down to test the "launch point" and only rally back up to the swing high point.

I don't usually look for head and shoulder patterns as a part of my trade signals. I only noticed this pattern when I wrote this blog entry. The standard H&S target, from the head to the neckline, was not reached. I would have liked an extra point for my second half of my position. :-)

Trade Wise, Trade Well
John

Thursday, May 31, 2007

Good with the Bad

Thursday May 31st, 2007

Spot Light Trade(s)

See the three circled areas for today's spotlight trades.


Trade 1 - The first circled area at 11:05 CT on the 1-minute chart above is one of the few good pull backs in price that had a nice defined stair step higher in my direction line on the 5 minute chart for today, and traded for decent distance in today's smaller range day. This low came in with a nice relative low in the NYSE Tick.

In the 20 minutes prior to this point in time, the higher volume spikes in the 1-minute chart were mostly sell volume. The price action "looked" like it was curving lower like it could break lower. The NYSE Tick was staying mostly above the zero line, so I was not really interested in trying a short, but it was enough to distract me from thinking long. I missed this one and this is usually a trade I really like.

Trade 2 - A similar setup to trade 1. This time I was ready and jumped on the signal and got long. Price worked to 1 point in favor, I wanted to try and hold for more profits. After all, it worked great on the prior trade right. Well.. that takes us into trade 3.

Trade 3 - Similar setup again, only reversed to the short side. Wanting to hold the prior trade kept my focus from the short side. The 5-minute chart had "flat lined" the trend for about an hour and did not give me any indication of this move. By the time I realized I had missed a short signal, I was lucky to scratch out of the last trade at break even. It would have been good to reverse my position from long to short, but I have not allowed that in my rules yet.

Why would I do this? There are some subtle clues. The Volume is really light compared to what is expected. But if you look at the 5-minute volume, the "heavier" volume candles are the Red candles. It is hard to say heavier when the volume is this light, but a warning sign.

I think I wanted to see an end of month rally make my long trade a winner. This kept me from seeing the short trade and acting upon it in time.

Trade Wise, Trade Well
John

Tight Price Action

Thursday May 31st, 2007 ES Futures

How did it go today

The 5-minute chart does not do the price action justice. Most of my entry signals for today came while price was in tight sideways chop. Notice in the light blue lines in the 5 minute chart below. These lines defines my calculated "immediate trend" that tells me the direction to focus on trades. If the lines "stair step" lower, I look for short entry signals and if the lines "stair step" higher, I'm looking for long trades. As you can see, there are not many steps in the same direction today.


Too often it seemed price was buzzing sideways in about a 1-point range for 10 to even 30 minutes. This left me scratching my head saying the signal really worked. It was just me who did not trust that price would not actual "move" against my entry and cause me to use a bigger stop that I wanted for the trade.
Trade Wise Trade Well
John

Tuesday, May 29, 2007

New Style - Spot Light Trade

Tuesday May 29th, 2007 ES Futures

Trying to be more brief - let me know if you like this format or the long style with more details.


How today felt
I was overly cautious today. I knew I would be gone for some of the day and did not want to dig a big hole when I would not be around as much to work my way back out. I felt I kept my focus pretty good in the morning, but still managed to force a few trades to add some small losses to my mix of trades.

Spot Light Trade
I caught one very good entry. Just before 10:42 CT I had a short signal. The initial look at the 5 minute chart makes this look like a counter trend trade. But by the close of the 10:45 CT candle, the 5-minute chart had a slightly lower high to indicate a potential change in direction.

I had to get going to my youngest daughter's graduation from preschool and the price action was trying to hold up. The NYSE Tick was looking weaker and I still liked being short here. As I needed to be gone already, I took the first half off at +0.50 seconds before the market decided to dive. :-(

All of a sudden I was up 2 points on my remaining position. Under normal circumstances I would now take profits on the first half and I would allow the second half to run with a loose stop. You may have already guessed, wanting to lock in some profits I crowded the stop and got knocked out at +2.0 points just before the market started lower again and I ran out the door.

Summary
I'm still forcing some extra trades that I should not be taking. I caught myself a couple times today, but still managed to place some of these extra trades. As price moves without me, I can not let myself "Feel" that I'm missing out as this feeling builds and will eventually drive me to force some trades if I do not clear the thought from my mind.

I don't expect to trade every move in the market. My system does not try to stay in the market all the time. I need to focus on the clearest and best entry signals.

Trade Wise, Trade Well
John

Thursday, May 24, 2007

High Volume Day

Market Observations

Today started slow. But it did not last long. Two of the first three 5 minute candles had volume less than the average expected for their time period. The average expectation for volume can be seen in the chart by looking at the blue line. this threshold value changes for each 15 minute time period of the day. Note how only a handful of 5 minute candles had volume less than the expected average.

The initial light volume had me cautious to trade in front of today's 9:00 CT report. I had nice long signals and wished I realized the volume picked up so this I would have tried one of my two long entries. The market took off to the up side after the report and hardly looked back.

Formidable Resistance. Price quickly turned when it bumped into the combination of the R1 pivot and the Market Profile Point of Control from yesterday.

Big Selling. Our afternoon sell off started early today. I can say I'm going to start allowing myself to take more counter trend trades. I had a "perfect" sell signal at the first touch, the second time up to the high quickly retreated back down. Secondary sell signals were a "higher risk" trade signal, but worked great.

Almost did it again. Did you notice where the Midday low came in? Well look... The initial low touched 1513.00 and this is 2 ticks lower than twice the first hours range.
S3 calling. Twice the first hours range could not hold up the market in the afternoon. The S3 pivot level was beckoning. It was a struggle to get there. We pierced through this value and hit the 1508 level which I still had noted as a prior POC level of importance. The market popped slightly higher to close for the day.
Trade Wise, Trade Well
John

Tuesday, May 22, 2007

Bad Moves

Monday 5/21/2007 ES Futures

How did it go

Got off to another bad start again today. I chased some trade entries when I should have just "thought" I missed the entry. Then I would have been glad I missed the entry watch price come back the other direction.

So once again, profits were eaten into by mistakes I should not have made.

The Chart for today will be in the Next post.

Trade Narrative

I have not heard from many people yet about this blog, I don't suspect there are a lot reading yet, but I'd love to hear from more of you. I'm trying to figure what level of detail to place in this public journal. Let me know. For now I'm switching more of a summary than I have used in my earlier posts.

Don't do that again - My first two trades I have to describe as "Chase" entries. This is where I enter late after the signal and can be as much as 1 point from where I feel the Signal triggered an entry. I was questioning the entry signals early as the volume was noticeable below the average expected volume for most of today. This light volume should have told me to ONLY take proper entries or wait for the next signal. My best entries can come a minute or two after the signal, but waiting for a better entry can also leave me out of the trade as well.

I took it easier and did not trade much more in the consolidation range that lasted for the first hour and a half of this morning's session. Saw some counter trend trades, but my rules have me on the sidelines until I have profits to risk against these trades.

Bought the Low - I felt a little better when I bent my counter trend rule and took a long trade near 1526.00 after 11:00 CT. This turned out to be the low of the day. I just saw a "big push" lower that only made a quick 2 tick lower low before price popped back up. On "low volume days" I like to fade the extreme moves. That is as long as we do not appear to be trending. Now if I just held on to this entry longer. I took some earlier profits, trying to make up for my first bad trades. My thought was that I'd reenter, but there was not a good entry until price had gone 5 points higher.

Hard to balance between "taking profits" and "letting profits run" and be right all the time. I just need to figure out how the market seems to make me feel that I get this wrong more than I get it right. :-)

Lessons Learned or Still Needing to Reinforce

Several lessons from today.
  1. Treat each trade separately - do not try to force one trade to compensate for prior losses.
  2. Do not chase Entries - I have told myself this before, but I keep chasing what I "want" to be a run away move. Not going to happen with low volume.
  3. Re-evaluate the Counter Trend Rule - On low volume days, I think I'll have to be more willing to take trades that are defined by my system as counter trend trades. I normally try to avoid these trades when I don't have profits built up for the day to risk on these trades. When price is chopping in a range, good signals occur on the edges of the range, but these is no real trend.
Trade Wise, Trade Well
John

Monday, May 21, 2007

Charting Issues

Monday 5/21/2007 ES Futures

How did it go

Got off to a bad start. My charts decided to give me grief this morning. For some reason Investor/RT (IRT) does not like one of my charts. My chart that breaks candles down for every 1000 contracts traded has been giving me troubles off and on for too long now. This is the chart I use to help time my entries. This morning my Volume Break Down showed no values for the last few days and the start of the morning.

I tried to fix the problem and ended up missing just more than the first hour of trading. Big mistake as there was still good price movement today and I let theses issues throw me off.


Trade Narrative

Just missed it - I missed two long signals at better than 1528.00 entry price. The first signal would have finished as a profitable trade. The second signal was showing signs of working too. I was not real excited to join the trade late over 1 point above the entry as price action seemed quiet with lighter than average volume. I was trying to decide if the up tend was going to continue and I missed another entry as price ticked through 1528.00 and continued higher.

I was starting to decide to not trade this "light volume" price action and missed a couple of good long price swings. Frustrations with my charts just before the session open got the better of me today.


Lessons Learned or Still Needing to Reinforce

I should not have let myself get drawn into trying to resolve what appears to me to be a bug in the chart program I use. The issue only effects history and has been working for new real time data added to the chart. Save these issues for after trading hours.

Still, I should have better trusted my signals and got myself back on track. I would have had a couple of good trades late in the morning. I backed off for the day as my mistakes tend to be made most often in the midday and afternoon portions of the session. This means I need to focus in the early morning to build initial profits for the day.


Trade Wise, Trade Well
John

Friday, May 18, 2007

Limited Screen Time

How it Went Today

Today went great. I was doing 
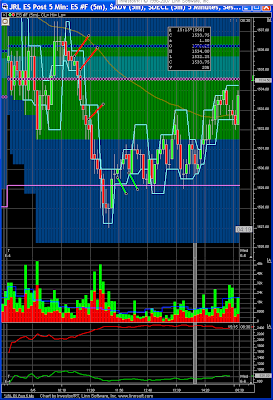
"my fatherly duties" today and did not have much real-time chart watching. So it was good to spend some time with the family and get a break from the charts. Here is a 5 minute chart to review how the day went.

Trade Narrative

I was around to see the market open. I was trying to decide if I was going to take any trades today knowing that I'd be away from the screens more than I'd be able to monitor the price action and my trades.

I don't have many entries right off of the open. My setups rely on current price action and sentiment to develop before I fell I have a high probability trade setup. I was really interested in shorting 1522.00 just off of the open, there was a nice pattern in my Volume Break Down Delta telling me to go short.

The trouble is that this pattern can quickly flip back to the long direction so I like to see some price action to go with this signal to be more confident I'm entering with the trend and not just catching a quick retracement in price.

I did short at 1521.00 to probe and see if the initial down trend was going to continue. My first half did not fill at +1 point. I knew there was a 9:00 CT report coming and my objective was to try and have a "free" trade with the second half of my position in case price breaks hard down from the report. When price stalled, I took half off at 0.75 points or three ticks. Normally I would have held, but since I had to leave before the report hits, I made a compromise. I needed to get out the door and price was starting to inch up at me so I placed the stop at break even and left. I was confident that the stop would be hit just a couple ticks way from price. Maybe I should have just closed the trade. Either way there was not a big difference.

From this point on, I had just a couple of times where I had the chance to "check the charts" to see what I had missed out on. Each time I looked it seemed like I had just missed my entry, price was still close, but the trade was a counter trend trade.

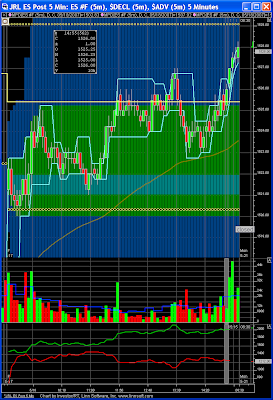
Shortly after 9:30 CT I really really wanted to short 1525. I had a major cluster of resistance there. The R2 value I had at 1525.50, I had a Market Profile Target at 1525.00, and a second possible Market Profile Target at 1526. We just have to get enough of a bounce off of this price area for a small profitable trade.

I should have noted the entry price I could have grabbed as I sat down to the screens. I passed and watched as price did work its way lower then channel tight sideways before I was off again. This trade should have been good for 2 points and 2 points for each half the way I trade.

This time I was gone longer than I expected. I returned just before 1:30 CT. It was a quick read, but I could still get short just under 1527. I decided that I have a bad track record for trades I "instantly" identify at first glance after being away from the screens for a period of time. Passed again. Another possible 2 - 3 points

The afternoon looked like it could be flat to slightly higher. Well... make that a close at new highs for the weekend hype. Should have thought about that, but decided just to observe.

Lessons Learned

Don't over do it - make sure you get some time away from the charts every now and then. I think I was over due for a break.

Observations

Another choppy day. The price action yesterday had better defined "micro trends" on the 5 minute chart as defined by the light blue lines around the price action. Today had consolidation periods where the "upper trend line" went lower and the "lower trend line" went higher.

Today seemed easier to trade, but did not offer the same profit potential. Granted I was not there is real time like I normally would have been. Let me know what you thought trading the ES was like today. Did you stay awake and focused through the consolidation to catch the moves?

Trade Wise, Trade Well
John

Thursday, May 17, 2007

Interesting ES Volume Fact for today

Interesting Action Today

Something happened today that threw me off track and helped shift me into taking more Short trades when my trend indications were actually saying "go long." This was the Volume Breakdown Delta Accumulation indicator. For those that do not know what it is, it is an indicator that can categorize or break down the volume traded to show if there is more buying pressure or more selling pressure.

Background

In the chart below I have added two versions of this indicator that I will reference from time to time in my other posts.
  1. Volume Breakdown Delta - The difference of the buy and sell volume for the current candle.
  2. Volume Breakdown Delta Accumulation - A running total for the above VB Delta.

I use the Up Tick and Down Tick option instead of the Bid and Ask option to calculate my Delta values. Both options produce very similar results, but I have found the Up Tick and Down Tick to suit my tastes better and provide fewer "fake out" moves. Usually the Delta Accumulation tracks reasonably well with price action. Meaning both values will make higher highs or lower lows together. When there is a difference or divergence, I feel the Delta often leads the price action in the turn. Nothing is 100% and focusing on the "short term" can be misleading if you don't also step back and compare with the "bigger picture" of price action.
So What Happened
Just look at today's price action compared to the VB Accumulation (VBA). I marked two areas on the chart with Pink trend lines. In both cases the ES made higher highs while the VBA actually chopped it's way lower in the first example and chopped relatively flat in the second time period. Also note the light Blue trend line showing how the ES Price put in a series of higher lows and the VBA put in a series of lower lows.
Once we got past the opening candles of the session, the VB Delta Accumulation drifted lower below the zero line all day. The horizontal Red trend line across the top of the VBA indicator is to highlight where the zero line. Note that while the ES put in new highs, the VBA went up, but still stayed below Zero.
What Does This Mean
To me, the "Big Players" are being sneaky about liquidating their long position that they have built up in the persistent up tend we have been in. They are not being aggressive and coming down in price to sell at the Bid. Instead they are letting new buyers lift the price to take out their long position.
I'm not trying to call a top and I wont call tops and bottoms. I job is to "trade what I see" and follow the price action as it unfolds. I do suspect there could be more price correction on the horizon, but it may just be another 1-day sell off like we have had recently and right back to the "Bull races" again.
Trade Wise, Trade Well
John

Monday, May 14, 2007

Interesting ES Fact for Today

Market Observation

I forgot to point out one interesting item in my trade review today. This happened in today's price action, but don't get real excited as this does not happen everyday. I'm trying to study it and see what I can discover.


What is it

The Low of the Day came in, to the Tick, at twice the range of the price action within the first hour of trading. Above is a 5 minute chart of the ES emini. There are three bands on color that show on the chart behind the price action.
  1. The narrow green band, is a 32% to 68% range of the first 15 minutes of trading. I use it to help me determine early directional trades.
  2. Wide green band - represents the price range of the first hour of trading.
  3. Blue Band - Twice the range of the first hour of trading.
Check out that low. Interesting, but need to discover how to use this when it does happen. The reverse can be true as well. That is, a high can come in at twice the range of the first hour of trading. On a choppy go-nowhere day, the price action can stay within the range developed within the first hour of trading.
Trade Wise, Trade Well
John