Showing posts with label Dr. Brett. Show all posts

Friday, July 13, 2007

Weak NYSE Tick Comment Link

Dr. Brett had some interesting comments on the recent weakness in the NYSE Tick that we have been seeing recently in a post today. Here is one of the comments I liked.
"What the Weak TICK Really Signifies - We saw an absence of buy programs among
the Russell 2000 stocks, keeping the TICK restrained."

Some people feel the Russell dynamics could be changing. The Russell is known for nice trend moves that usually cover a greater profit distance than the equivalent move in the ES. As of recent, the Russell seems to not make these "extended moves" as often.

Trade Wise, Trade Well
John

Thursday, June 21, 2007

Indicator Update

Thursday June 21st, 2001 ES Futures.

I had a good day today. Still not capturing all that I feel I should, but I feel like I'm getting back on track. I need to start keeping score based on the number of "good signals" I take and the number of times I try to "jump on" a trade late. Based on my track record, I am far better off fading the move for a 1 point counter trend scalp trade than I would entering the trend trade late with a 1 - 2 point stop. I respect what FlatWallet is doing keeping score on a two week count down to consistently follow his method. I should come up with something similar for my discipline.

What about the Indicators

Thought I'd share an update showing my two filter indicators CAT (Purple) and Mini ADV (Blue). Thanks go to Dr. Brett for inspiring these indicators. The CAT is a copy of his Cumulative Adjusted Tick, and the Mini ADV is a twist I created based off of his Relative Dollar Flow. As you can see in the following 1-minute chart of the ES for today, both of these indicators tracked with the trend fairly well.

The CAT mimicked all of the swings the best. But overall showed more weakness today than is reflected in the actual price action. Turns are more often than not signalled late as well.

The Mini ADV signalled the turns much better. I added yellow vertical lines to compare the turning points through the chart. Several of the turns were double tops or bottoms and I only highlighted the candle with the most extreme tick reading of the two. Mini ADV either "turned" at the first top or bottom or "turned" between the two.

I need to do a lot more research with these "filter" indicators. They did help me today to stay with what seemed like the constantly changing trend. I specifically want to figure out why the Mini ADV did not represent the first swing lower.

Trade Wise, Trade Well
John

Mini Advance Decline

The biggest thing I don't like about the NYSE ADV - Advancing Issues is that it tracks from the prior day's close. I can see the Gap in prices and I don't need a "false indication" that is generated by the gap. I want to know what the stocks are doing for me today. Also since stocks have a staggered opening, it takes some time for the ADV to "build up steam" and become useful off the opening. I find this is often 15 - 20 minutes.

For fun I took Dr. Brett's stocks used in his Relative Dollar Volume Flow and made my own Mini-ADV. I trying out an indication of Up or down from the Open.


How Does it Work

I need to do more research, but I find it interesting so far. Notice the high in the ES Futures at 9:45 CT. The Mini ADV is the blue line at the bottom of the chart. It was working its way lower. Time will tell.

Remember

This is not a new "magical indicator" to pick trades. This is just a potential filter tool.

Trade Wise, Trade Well
John

Friday, June 15, 2007

CAT Indicator

Cumulative Adjusted Tick Indicator

I have my current implementation for Dr. Brett's cumulative adjusted tick indicator that I refer to as CAT. Quick background - CAT is a running total for the current day of the 1 minute NYSE Tick close value that has been adjusted by the average Tick value for the past 20 days. If you are an Investor/RT user let me know.

Not Exact

I had been unable to match Dr. Brett's values as shown in his May 24 post and parked the indicator. I decided to dust it off this week as I have been looking for an indication of trend days to help hold for the bigger moves.
My values still don't match exactly, but are "close enough" for now. You can see how my indicator crests just over the zero line before showing a nice down trend on May 24th, 2007 below. Dr. Brett's indicator never goes above the zero line the entire day.

Other than the differences in the values, I do like what I'm seeing from this indicator. More historical research is needed to see how this reacts in different market conditions.

Sample Charts

Down Trend - May 24th, 2007 and June 7th, 2007 are remarkably similar days and show how the CAT behaves on a strong down trend day.


Choppy Day or Mixed day - Today's chart, June 15th, 2007 is a decent sample for a chart that has mixed up and down trends with some choppy periods as well. I found it interesting that the CAT showed a trend into the close, but that price did not follow through.


Trade Wise, Trade Well,
John

Tuesday, June 5, 2007

Baby Steps

Tuesday June 5th, 2007 ES Futures

How did Today go

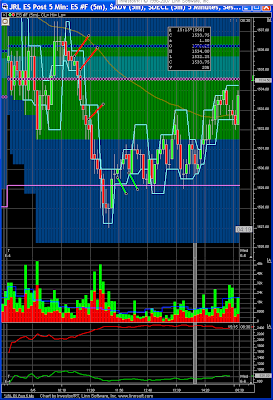
Today was not a banner day for me. I ended up positive, but I definitely needed to take some "Blind Faith" trades to make today deliver the results I would have expected for today. I had four occasions where I found myself saying I should be in a trade, but ended up watching anyway. See the Red lines (first two) for short trades and the green lines for long trades.


I think I'm being overly judgemental about my entries. Last week I found myself chasing price after taking too long to decide that a signal was good. When the market is not trending, chasing a price swing ends in a scratch trade 80% of the time and that requires me to "give up" on the trade before price retraces and would often hit my stop for a small loss.

I'm also trying to press myself to take the signal at the "right time" or to let the trade go after reading Dr. Brett's comments about the replies to his Coaching Project and today's Discipline post. If I had to place myself in one of the categories Dr. Brett describes in the Discipline post it would have to be the volatility category.

It feels weird to me to say the cause to my discipline breakdown is volatility. But I can make an association. The signals I'm passing on too often are tight coils where price often moves sideways for 10 to 15 minutes. Today's first short example fits this to a tee. Price went down 9 of 10 points before we had a rally of more than a point. I had several "confirmed short" signals but passed as I always felt I was shorting the low.

I think a mental association with shorting the low is more apt to be the cause. I feel I built this association by "chasing" entries late. Since price often moves in surges, a late entry will more often then not comes at or near the next "counter trend" signal in my system. Then price usually retraces enough that I have a hard time justify holding on to these trades. On a choppy day, these surge moves are often the head face before price turns back into the chop.

But now I'm in a catch 22. My discipline problem is caused by a discipline problem... Err, lets not go there.

I will say watching the 5 minute volume helped to keep me from taking some counter trend trades. Starting with the first Red candle of the down trend (just before the second high in the double top) at 10:10 CT we had light volume followed by an increase in volume as the trend started down. Then the 10:20 CT candle had lighter overall volume, BUT note that the "Sell Volume" as indicated by the Red portion of the volume bar increased from the prior bar even with the lighter volume.

This afternoon, I found Volume to be a much harder read.

Trade Wise, Trade Well
John

Sunday, May 6, 2007

Dr Brett Steenbarger Voice Seminar

Before I start my family obligations for today, I was able to get up early and attend a voice conference where Dr. Brett Steenbarger was the presenter. I try to review everything Dr. Brett has to say in his posts on the WebLog on his personal site, his Blog, and now really look forward to new events like this Voice Conference.

I Feel he goes above and beyond at freely sharing market insight, thoughts, and research. I take everything to heart and have been able to tweak and grow my trading from the enormous quantity of market details he shares on these sights.

I'll edit in a link when the recording of the conference is made available for replay. Or just watch his site for the direct post on this great event.

Very Good Conference

Dr. Brett went through some topics that were beneficial to me and my future as a trader. Two "simple setups" were presented. If you are interested, review the replay to get a direct understanding of these setups. The details of these two setups have not and will not be posted. These details are only available from this voice conference.

For these setups, recent market conditions are researched to determine if there is an "Edge" that could be exploited going forward. See a recent example of When Large Cap Stocks Outperform Small Caps. The odds of both successful and unsuccessful trades are presented along with the historical average return.

I found it interesting to hear how Dr. Brett then utilizes this research to place his own trades. One setup had a positive expectancy over the next four day period. Dr. Brett does not just buy and hold for this entire time frame. Instead, intraday trades are placed in the direction that the research shows has an edge. Before entering the trade, current market conditions are evaluated to determine that they support the researched edge.

I could see some similarities in Dr. Brett's trading and my own. We both place a position and "take off" some profits for the "psychological win" perspective of our own trading. Then a portion of the position is allow to run (market permitting) for more profits. Dr. Brett takes off 3/4 of his initial position where I'm using 1/2 the position for my first profit taking.

There are also many differences in our styles. I'm willing to take more entries per day and potentially have small wins, losses, or scratch trades probing for profitable trend moves to trade. Currently I'm not doing research to set any probable expectations for the day or near future. My current goal is to correctly react to the price action as if forms for throughout the day. I need to evaluate if similar research could help my trading, but that is further down the road.

One of the points presented matches my thoughts about trading and can be found in this blog's first post titled: My Start. The point being that every trader needs to find "their trading style" to be successful. One should not assume a trading style is a match to their personality. A strategy needs to be tweaked and become "your own" style. Don't just blindly try to mimic someone else's trading style and "Hope" to become a successful trader. (There is that Hope word again...)

After the conference, I found myself with a new vitality and interest to dive deeper into several concepts from the call.

My Main Take Aways

Review postings - I plan on researching Dr Brett's posting to review additional comments on "Reversal" and "Breakout" patterns. These are post I have read in the past, but now want to re-review to gain a deeper and refreshed understanding. I'm sure I'll have more posts on my thoughts from this review yet to come.

This interest comes from conference comments about "momentum peaks" and their characteristics. I saw an interesting alignment between these momentum peaks and some of my own trade setups. I just may find some additional setup ideas or even trade filters to help reduce losing trades.

Average ES Volume - I want to dust off and complete a prior project, developing an Average Volume Indicator. Dr. Brett calculated a table for the average volume for each 15-minute trading period in the ES (S&P Futures) for the past 20 days. See his post: Volume and Opportunity in the Stock Market. I feel this will help me judge volume much better for my trade setups.

I have stated that I like to see increased volume as price moves in the direction of the trend. See the Volume section of the My Trade Setup posting. Without an increase in volume, price will be more likely to reverse. But as volume falls off during the slower midday trading period it becomes more and more difficult to judge volume. Understanding if volume remains above the average for each time period should help me improve my volume perspective.

Journal - My purpose for this blog is a journal primarily for my own benefit. If others find reviewing my thoughts and asking questions also helps them in their trading then all the better. From my past computer consulting days I often conduced training classes. For me, I found that striving to describe and convey knowledge to others improved my own thoughts and depth of knowledge on a topic.

The topic of a "cognitive journal" was presented in the conference. The cognitive aspect should contain "challenging self talk" that would "interrupt the thought process." The interruption is to examine or re-evaluate the details and help make sure the right decision was made. Also, harmful "negative thoughts" are removed and details thought of in a positive light.

This made me think about my recent blog comment from Friday's Trade Setup Review. I found I had to tell myself in the Flip a Coin section of my narrative that while I wanted to enter a long trade, my recent entry signals were actually Short signals. I feel I actually kept myself from putting on a losing long trade when my emotions were tell me to get long.

So what is the take away... To make sure that this blog covers the cognitive aspect for my own self review of my trades. I'll review the chapter on journals from Dr. Brett's Enhancing Trader Performance book to make sure I'm covering the bases.

I always find excellent trading tidbits in Dr. Brett's posts. He shares his market details with the true intent of helping other traders be successful. I applaud him and also thank him as I have benefited from his sharing.

Trade Wise, Trade Well
John