Monday July 17th, 2007 ES Futures
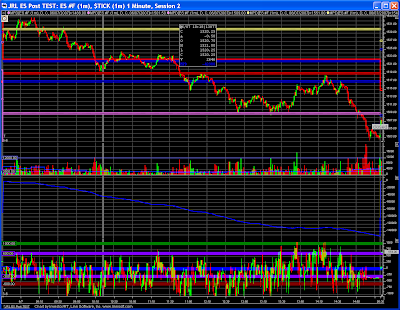
The NYSE Tick is continuing to display weakness that is not typical of the ES price action. I started to really like the filter capability of the Cumulative Adjusted Tick or CAT Indicator. My problem of recent has been that the continued weakness in the Tick is severe enough to produce CAT readings that no longer match the ES price action and reducing the value of this indicator as a trade direction filter.
I have been playing with some modified Tick calculations. Currently I plan on maintaining the original calculation for the CAT indicator. But the modified calculations help me "see" when weakness in the Tick is producing a bad filter reading. More research will tell me if the modified calculations will help filter my trade directions.
Trade Wise, Trade Well
John
Showing posts with label Custom Indicator. Show all posts
Showing posts with label Custom Indicator. Show all posts
Monday, July 16, 2007

Thursday, June 28, 2007
Did It Again
Thursday June 28th, 2007 ES Futures - FOMC Day
Today the CAT Indicator kept driving higher up until the FOMC Meeting, but price was choppy and driving sideways for the majority of this time. This is another case of price having to "catch up" to what the CAT Indicator is predicting to be happening. An earlier posts shows this happening to the short side and today was a good long play example.

I still need to do some more research to verify that this is not just a recent phenonmenon. But I find this a very interesting and so far a reliable clue towards price action produced from the CAT Indicator.
Today the CAT Indicator kept driving higher up until the FOMC Meeting, but price was choppy and driving sideways for the majority of this time. This is another case of price having to "catch up" to what the CAT Indicator is predicting to be happening. An earlier posts shows this happening to the short side and today was a good long play example.

I still need to do some more research to verify that this is not just a recent phenonmenon. But I find this a very interesting and so far a reliable clue towards price action produced from the CAT Indicator.
Trade Well, Trade Wise
John
Wednesday, June 27, 2007
Buy, Buy, Buy
Wednesday June 27th, 2007 ES Futures
Buy, Buy, Buy is what the CAT indicator said most all day today. There was an initial dip below zero off the open. It is hard to see in the compressed 1-minute chart, but it was all up from that early CAT low. Every dip in price high showed a higher low in the CAT indicator.
 Now if I just listened better, I would have had a much better day. I must figure out why I end up fighting the trend as much as I do.
Trade Wise, Trade Well
John
Buy, Buy, Buy is what the CAT indicator said most all day today. There was an initial dip below zero off the open. It is hard to see in the compressed 1-minute chart, but it was all up from that early CAT low. Every dip in price high showed a higher low in the CAT indicator.
 Now if I just listened better, I would have had a much better day. I must figure out why I end up fighting the trend as much as I do.
Trade Wise, Trade Well
John
Sunday, June 24, 2007
Indicator Issue Fixed
When I investigated why my Mini ADV Indicator did not show the initial drop on Thursday the 21st of June, I discovered a couple of issues. One change to the calculation that would have effected historical chart review and another data issue that I believe caused some of the chart discrepancies. Here is what the chart should have looked like.

I like how this filter indicator seems to support the indication of turns in the market. Still more research to do.
Trade Wise, Trade Well
John

I like how this filter indicator seems to support the indication of turns in the market. Still more research to do.
Trade Wise, Trade Well
John
Thursday, June 21, 2007
Indicator Update
Thursday June 21st, 2001 ES Futures.
I had a good day today. Still not capturing all that I feel I should, but I feel like I'm getting back on track. I need to start keeping score based on the number of "good signals" I take and the number of times I try to "jump on" a trade late. Based on my track record, I am far better off fading the move for a 1 point counter trend scalp trade than I would entering the trend trade late with a 1 - 2 point stop. I respect what FlatWallet is doing keeping score on a two week count down to consistently follow his method. I should come up with something similar for my discipline.
What about the Indicators
Thought I'd share an update showing my two filter indicators CAT (Purple) and Mini ADV (Blue). Thanks go to Dr. Brett for inspiring these indicators. The CAT is a copy of his Cumulative Adjusted Tick, and the Mini ADV is a twist I created based off of his Relative Dollar Flow. As you can see in the following 1-minute chart of the ES for today, both of these indicators tracked with the trend fairly well.
 The CAT mimicked all of the swings the best. But overall showed more weakness today than is reflected in the actual price action. Turns are more often than not signalled late as well.
The Mini ADV signalled the turns much better. I added yellow vertical lines to compare the turning points through the chart. Several of the turns were double tops or bottoms and I only highlighted the candle with the most extreme tick reading of the two. Mini ADV either "turned" at the first top or bottom or "turned" between the two.
I need to do a lot more research with these "filter" indicators. They did help me today to stay with what seemed like the constantly changing trend. I specifically want to figure out why the Mini ADV did not represent the first swing lower.
Trade Wise, Trade Well
John
I had a good day today. Still not capturing all that I feel I should, but I feel like I'm getting back on track. I need to start keeping score based on the number of "good signals" I take and the number of times I try to "jump on" a trade late. Based on my track record, I am far better off fading the move for a 1 point counter trend scalp trade than I would entering the trend trade late with a 1 - 2 point stop. I respect what FlatWallet is doing keeping score on a two week count down to consistently follow his method. I should come up with something similar for my discipline.
What about the Indicators
Thought I'd share an update showing my two filter indicators CAT (Purple) and Mini ADV (Blue). Thanks go to Dr. Brett for inspiring these indicators. The CAT is a copy of his Cumulative Adjusted Tick, and the Mini ADV is a twist I created based off of his Relative Dollar Flow. As you can see in the following 1-minute chart of the ES for today, both of these indicators tracked with the trend fairly well.
 The CAT mimicked all of the swings the best. But overall showed more weakness today than is reflected in the actual price action. Turns are more often than not signalled late as well.
The Mini ADV signalled the turns much better. I added yellow vertical lines to compare the turning points through the chart. Several of the turns were double tops or bottoms and I only highlighted the candle with the most extreme tick reading of the two. Mini ADV either "turned" at the first top or bottom or "turned" between the two.
I need to do a lot more research with these "filter" indicators. They did help me today to stay with what seemed like the constantly changing trend. I specifically want to figure out why the Mini ADV did not represent the first swing lower.
Trade Wise, Trade Well
John
Mini Advance Decline
The biggest thing I don't like about the NYSE ADV - Advancing Issues is that it tracks from the prior day's close. I can see the Gap in prices and I don't need a "false indication" that is generated by the gap. I want to know what the stocks are doing for me today. Also since stocks have a staggered opening, it takes some time for the ADV to "build up steam" and become useful off the opening. I find this is often 15 - 20 minutes.
For fun I took Dr. Brett's stocks used in his Relative Dollar Volume Flow and made my own Mini-ADV. I trying out an indication of Up or down from the Open.
For fun I took Dr. Brett's stocks used in his Relative Dollar Volume Flow and made my own Mini-ADV. I trying out an indication of Up or down from the Open.

How Does it Work
I need to do more research, but I find it interesting so far. Notice the high in the ES Futures at 9:45 CT. The Mini ADV is the blue line at the bottom of the chart. It was working its way lower. Time will tell.
Remember
This is not a new "magical indicator" to pick trades. This is just a potential filter tool.
Trade Wise, Trade Well
John
Friday, June 15, 2007
CAT Indicator
Cumulative Adjusted Tick Indicator
I have my current implementation for Dr. Brett's cumulative adjusted tick indicator that I refer to as CAT. Quick background - CAT is a running total for the current day of the 1 minute NYSE Tick close value that has been adjusted by the average Tick value for the past 20 days. If you are an Investor/RT user let me know.
Not Exact
I had been unable to match Dr. Brett's values as shown in his May 24 post and parked the indicator. I decided to dust it off this week as I have been looking for an indication of trend days to help hold for the bigger moves.
My values still don't match exactly, but are "close enough" for now. You can see how my indicator crests just over the zero line before showing a nice down trend on May 24th, 2007 below. Dr. Brett's indicator never goes above the zero line the entire day.
 Other than the differences in the values, I do like what I'm seeing from this indicator. More historical research is needed to see how this reacts in different market conditions.
Choppy Day or Mixed day - Today's chart, June 15th, 2007 is a decent sample for a chart that has mixed up and down trends with some choppy periods as well. I found it interesting that the CAT showed a trend into the close, but that price did not follow through.
I have my current implementation for Dr. Brett's cumulative adjusted tick indicator that I refer to as CAT. Quick background - CAT is a running total for the current day of the 1 minute NYSE Tick close value that has been adjusted by the average Tick value for the past 20 days. If you are an Investor/RT user let me know.
Not Exact
I had been unable to match Dr. Brett's values as shown in his May 24 post and parked the indicator. I decided to dust it off this week as I have been looking for an indication of trend days to help hold for the bigger moves.
My values still don't match exactly, but are "close enough" for now. You can see how my indicator crests just over the zero line before showing a nice down trend on May 24th, 2007 below. Dr. Brett's indicator never goes above the zero line the entire day.
 Other than the differences in the values, I do like what I'm seeing from this indicator. More historical research is needed to see how this reacts in different market conditions.
 Sample Charts
Down Trend - May 24th, 2007 and June 7th, 2007 are remarkably similar days and show how the CAT behaves on a strong down trend day.

Choppy Day or Mixed day - Today's chart, June 15th, 2007 is a decent sample for a chart that has mixed up and down trends with some choppy periods as well. I found it interesting that the CAT showed a trend into the close, but that price did not follow through.

Trade Wise, Trade Well,
John
Tuesday, May 8, 2007
Average Volume Implementation
Introduction
I really liked Dr. Brett Steenbarger's Volume and Opportunity in the Stock Market blog post. I had wanted something to help me judge volume levels as the markets slowed down durring the midday action. This makes sense to me, and I think it can payoff in helping me filter my trade selection better.
First Version Implementation
I have completed the first version of my average volume implementation for the ES. The purpose of this indicator is to display a reference line on the chart at the level where volume should be averaging for the current 15 minute period.
One of my goals was to be able to use this indicator on several different time periods. The two primary time based chart I watch throughout the day are a 1-minute and a 5-minute chart. For the "15 minute average" to make sense on these charts I decided to take the average for the 15-minute period and break it down to a 1-minute value within the period. Then I calculate the 15-minute bar period using the following formula:
INT(((SBAR - 1) * MPB) / 15) + 1
The following is a description of the Investor/RT functions:
INT is the integer function
SBAR returns the number for the current bar in the session
MPB indicates the number of minutes displayed per bar
Now I just display the right 1 -minute average based on the calculated 15-minute period. For this to work on multiple time frames I must multiple the 1-minute average by the minutes per bar (MPB) function value.
If you use either Investor/RT or Market Delta (both developed by Linnsoft), I can send you a chart template if you are interested in this indicator.
Side note - The beta implementation used IRT's BARNO function. This was replaced by the SBAR function when I discovered that BARNO seemed to "restart" the bar number value for some reason. I discovered the SBAR function while trying to figure out what was going wrong. I never figured out why BARNO did not work after discovering SBAR did what I needed.
Limitations
Hard coded 15-minute values - For this first implementation I'm not dynamically calculating the 20 day average volume for the period. So my values are hard coded to Dr. Brett's values for now.
Only for 15-minute periods or less - This indicator was not designed to work for charts greater than a 15-minute time frame. I make no attempt to combine 15-minute averages to use on higher time frame charts.
Enhancements
The first enhancement is to add a component to update the 20-day average that is used for each 15-minute period. I do not want to waste calculating time to have the main indicator perform this calculation. There is no need to repeatedly perform this calculation throughout the day.
Investor/RT support a display of multiple time periods on the same chart. I'm interested in using this capability to add the 15-minute total volume to the lower time frame charts. I would also add the "combined" 15-minute value as another reference level.
Next Steps
The immediate next step for me is to review historical charts to get a better feel for this new average volume indicator and see how it can help me in my trade selection.
Trade Wise, Trade Well
John
I really liked Dr. Brett Steenbarger's Volume and Opportunity in the Stock Market blog post. I had wanted something to help me judge volume levels as the markets slowed down durring the midday action. This makes sense to me, and I think it can payoff in helping me filter my trade selection better.
First Version Implementation
I have completed the first version of my average volume implementation for the ES. The purpose of this indicator is to display a reference line on the chart at the level where volume should be averaging for the current 15 minute period.
One of my goals was to be able to use this indicator on several different time periods. The two primary time based chart I watch throughout the day are a 1-minute and a 5-minute chart. For the "15 minute average" to make sense on these charts I decided to take the average for the 15-minute period and break it down to a 1-minute value within the period. Then I calculate the 15-minute bar period using the following formula:
INT(((SBAR - 1) * MPB) / 15) + 1
The following is a description of the Investor/RT functions:
INT is the integer function
SBAR returns the number for the current bar in the session
MPB indicates the number of minutes displayed per bar
Now I just display the right 1 -minute average based on the calculated 15-minute period. For this to work on multiple time frames I must multiple the 1-minute average by the minutes per bar (MPB) function value.
If you use either Investor/RT or Market Delta (both developed by Linnsoft), I can send you a chart template if you are interested in this indicator.
Side note - The beta implementation used IRT's BARNO function. This was replaced by the SBAR function when I discovered that BARNO seemed to "restart" the bar number value for some reason. I discovered the SBAR function while trying to figure out what was going wrong. I never figured out why BARNO did not work after discovering SBAR did what I needed.
Limitations
Hard coded 15-minute values - For this first implementation I'm not dynamically calculating the 20 day average volume for the period. So my values are hard coded to Dr. Brett's values for now.
Only for 15-minute periods or less - This indicator was not designed to work for charts greater than a 15-minute time frame. I make no attempt to combine 15-minute averages to use on higher time frame charts.
Enhancements
The first enhancement is to add a component to update the 20-day average that is used for each 15-minute period. I do not want to waste calculating time to have the main indicator perform this calculation. There is no need to repeatedly perform this calculation throughout the day.
Investor/RT support a display of multiple time periods on the same chart. I'm interested in using this capability to add the 15-minute total volume to the lower time frame charts. I would also add the "combined" 15-minute value as another reference level.
Next Steps
The immediate next step for me is to review historical charts to get a better feel for this new average volume indicator and see how it can help me in my trade selection.
Trade Wise, Trade Well
John
Subscribe to:
Posts (Atom)
